Technical Analysis
Ripple Technical Analysis XRP/USD 28/03/2018

In technical analysis last week, I was saying that Bitcoin might have made a lower minimum (7,200 USD) than the previous minimum (6,000 USD). I was saying that in order to be sure that a higher minimum had happened, we needed an upward movement to 12,000 USD. This confirmation has not come. After the price has moved up for three days, the up movement has failed and we still have a downward move. In conclusion, the Bitcoin price is looking for a new return area. Of course, it is possible to have an upper minimum in the 7250 USD area, or even the minimum of 6000 USD to be tested once again.
Many technical analysts have been as convinced as Bitcoin will have an upward movement to 12,000 USD. Here, at the moment, our predictions have not been met. In the scenario where Bitcoin would have climbed to 12,000 USD, the XRP/USD parity would have gone upward to 1 USD. I said in the analysis last time that we still have a doubt that XRP/USD can reach 1 USD, because the volumes traded were rather small and could not sustain an increase of up to 1 USD.
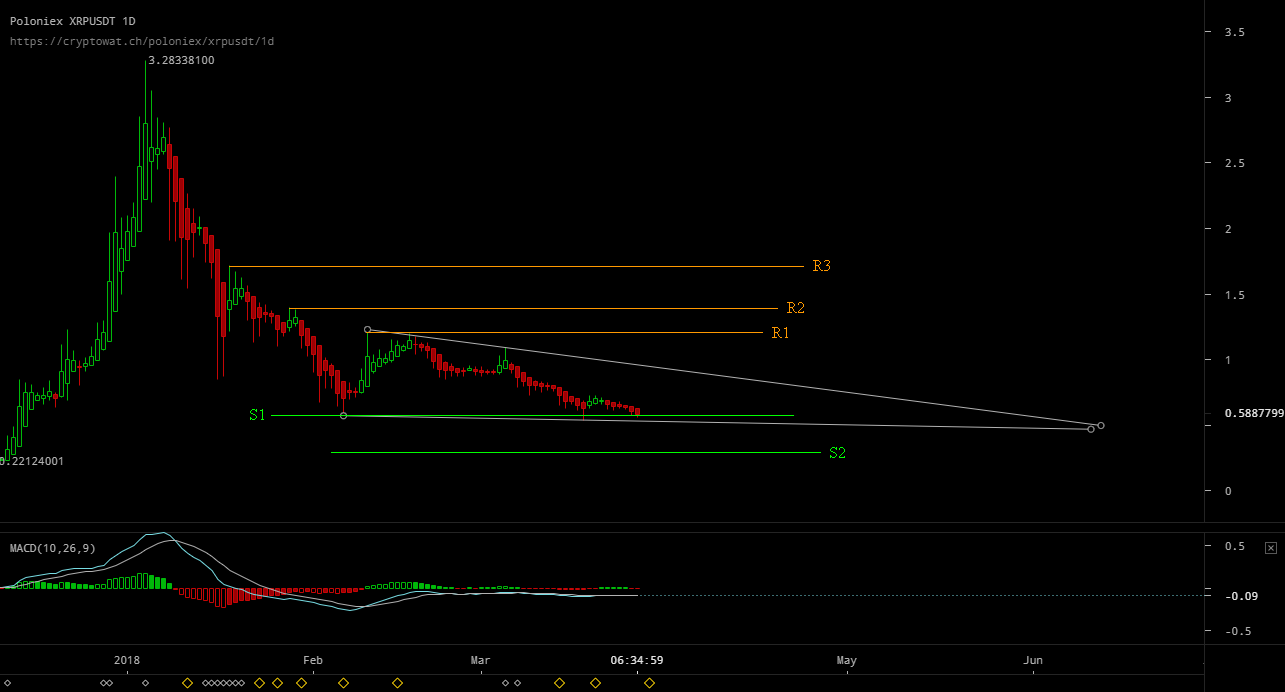
The resistance lines are: The support lines are:
R1 – 1,25 USD S1 – 0,55 USD (psychological)
R2 – 1,4 USD S2 – 0,25 USD
R3 – 1,72 USD
What can we expect in the next week?
XRP/USD tests for the third time, S1 support – 0.55 USD. As you can see, a pattern falling wadge was formed on the chart. This is a bull pattern. When can we see impulsive upward movement? That impulsive upward motion occurs where the tip of the triangle is formed, more precisely somewhere in June. Will we really keep inside this pattern until June? It is hard to believe that we will have a lateral movement with such low oscillations until June. For this week, I expect a lateral movement with once again testing the psychological support area at 0.55-0.50 usd. If Bitcoin continues to move downward, it is possible to break down (short time) this psychological area.
At the end of today’s technical analysis, I have some conclusions resulting from the Bitcoin and XRP price move over the last two weeks.
The current consolidation period is much more complicated than we originally anticipated. It is a complex type of consolidation that will have many surprising oscillations. This consolidation can take place over a period of 6-12 months. These days, I’ve noticed tests of certain price levels. Big traders, some of them using bots of trading, test the levels at which other market participants are willing to support the price. How did we reach this conclusion? Well, there were short ascending movements, followed by a few hours of short descending movements. You will say it can be a simple pump and dump. From my point of view, pump and dump is not a plausible answer. Why? Because the gain (%) would be too low. The small gain obtained would not justify the effort. In conclusion, whales test their forces and support other market participants.
A positive fact is that the volumes traded are not high and there are no panic sales. Fewer traders are willing to sell their XRP coins. The price is “kept” down.


Bitcoin’s Value Climbs Above $71,000 Ahead of Impending Halving Event

Best Bitcoin Miners in 2024

BlockDAG’s Visionary Leap: Sparking a Crypto Revolution with 5000% ROI Potential

Earn Passive Income Quickly with ARKMining Cloud Mining – Daily Profits

Bitcoin Boom vs China’s Ban: Investors Caught in Crossfire

BlockDAG’s Visionary Leap: Sparking a Crypto Revolution with 5000% ROI Potential
BlockDAG’s groundbreaking announcement has stirred a wave of excitement in the cryptocurrency community, following its keynote presentation broadcasted across the...

Earn Passive Income Quickly with ARKMining Cloud Mining – Daily Profits
ARKMining, a leading cloud mining platform, recently released a complete analysis report demonstrating its potential to help individuals easily earn...


Top Crypto Altcoins of 2024: SHIB, MK, and BDAG – Unlock Your Path to Growth and Profit
The best crypto altcoins of 2024, according to top crypto analysts are Shiba Inu (SHIB), Meme Kombat (MK), and BlockDAG...

Insiders Reveal: BlockDAG’s Presale Poised for 50X Boom with Possible Bitcoin Breakout on the Way; BTCMTX Presale Set to End
The Bitcoin rally may still have room for further growth following a recent breakout. However, increased Bitcoin volatility could occur,...


Wizarbit – Quick Bitcoin Purchase with Credit Card
In the fast-paced world of cryptocurrency, convenience and speed are paramount. Wizarbit emerges as a trailblazer in facilitating swift Bitcoin...
