Technical Analysis
Ripple Technical Analysis XRP/USD, XRP/BTC 04/20/2018

From the News
Even as Ripple cement its spot as the 3rd most valuable cryptocurrency, it still advocates for regulation. By now you know that regulation is the only barrier that is preventing big money from investing in this niche.
Ripple needs legit, rule complaint investors and that is why they are appealing to the UK government to introduce supportive, guard-railing regulations in what Ryan Zagone, Head of Compliance, calls the “Wild West” of blockchain technology. KYC, AML, consumer protection and financial stability are some proposed regulations fronted by Ripple but let’s wait and see what happens.
Elsewhere, Citibank is reviewing Ripple and XRP. Even though they remain cautious of possible risks that some exchanges trading XRP are not yet under strict AML or ATF rules, they all but confirm that XRP is unlikely to be used as a token of international bank settlement.
Citi Bank Reviews Ripple and XRP
BANK OF THE FUTURE
The ABCs of Digital Disruption in Finance.
Big Thanks To @XRPTrump for the input#Ripple #XRP pic.twitter.com/oWsbXGwtly
— Bank XRP (@BankXRP) April 17, 2018
Anyway, if anything comes out of this then it would be interesting because news is Ripple is also talking with SWIFT. SWIFT has its own network connecting over 10,000 banks in more than 200 countries. Of course, if there is a merger with xRapid, XRP prices would definitely explode.
Ripple (XRP/USD) Technical Analysis
Still, Ripple is on the rise and from our previous Ripple price forecast, price action is towing in. Week over week, Ripple is up 24 percent and chances of Bitcoin Cash occupying the number 3 spot is apparently slim to none. Ripple market cap stands at $29.34 Billion as I type this and technical indicators points to further appreciation.
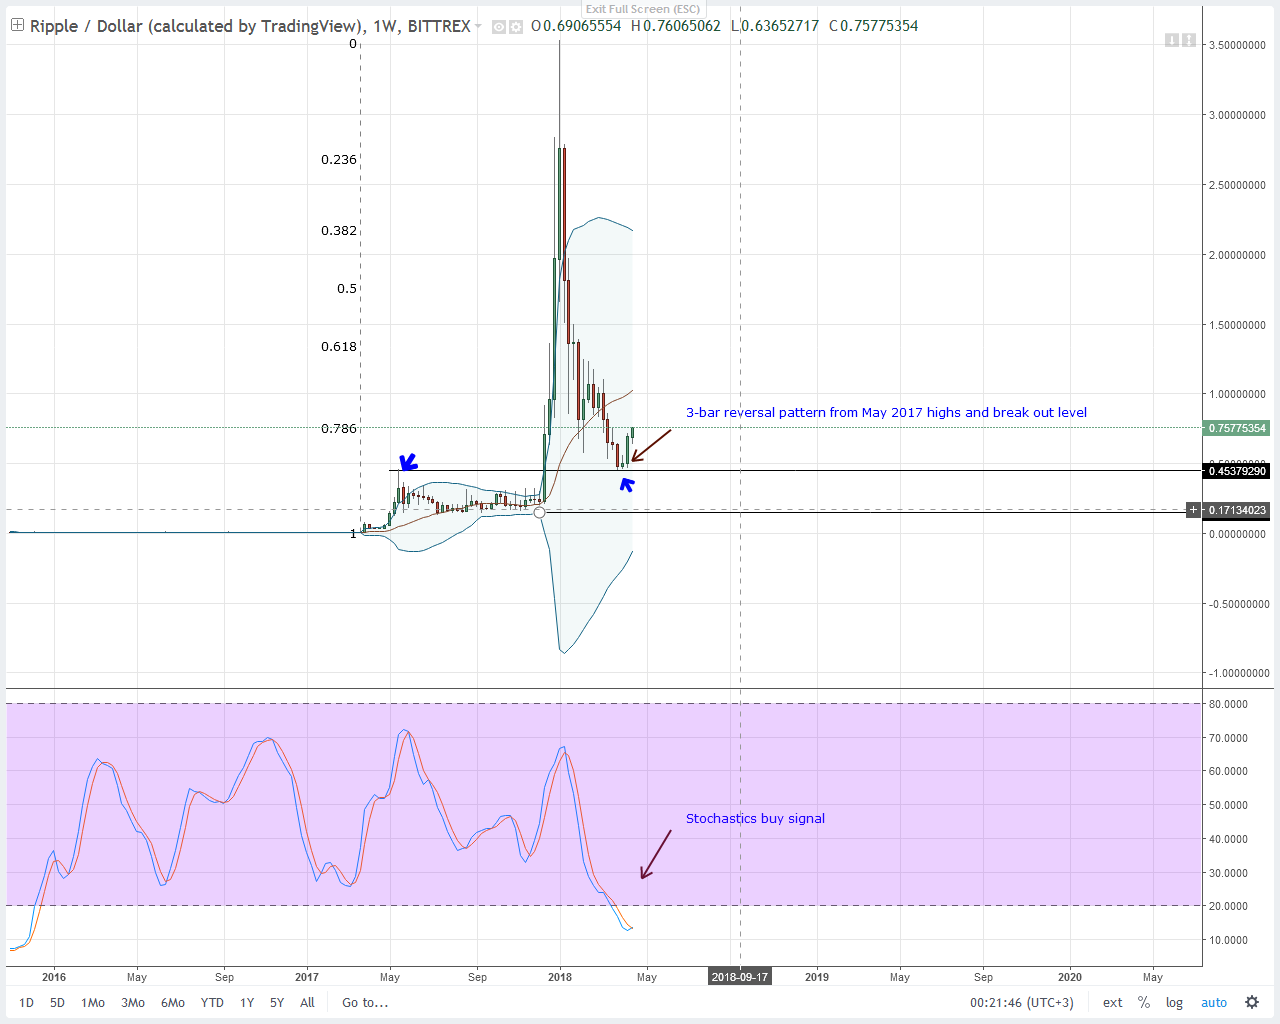
From the weekly chart we can see stochastics trying to turn from deep the oversold territory. Should this week end up bullish then we can be certain of a double bar reversal pattern from previous resistance now support at $0.45. That’s not all. This technical development could also mean the beginning of the 3rd phase of a bull resumption phase typical in a bullish break out pattern.
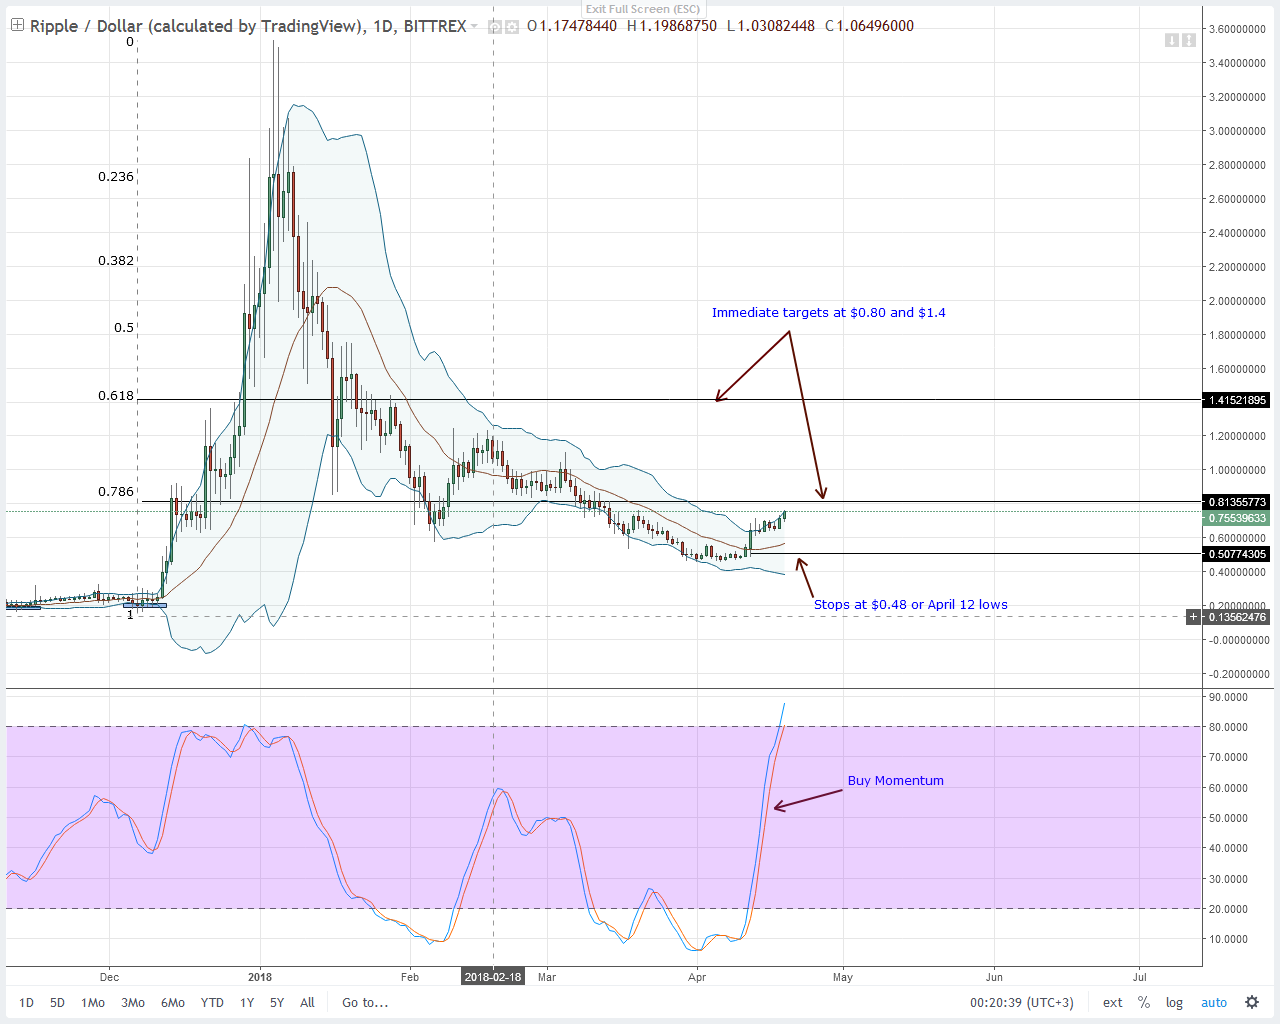
Already we have a stochastic buy signal and as Ripple price continue to appreciate, our focus shifts of short term resistance levels at $0.80 and $1.40. Thing is these past bullish candlesticks banding along the upper BB are indicative of buy pressure. If they surge through the 78.6% Fibonacci retracement at $0.8, expect further gains next week.
Ripple (XRP/BTC) Technical Analysis
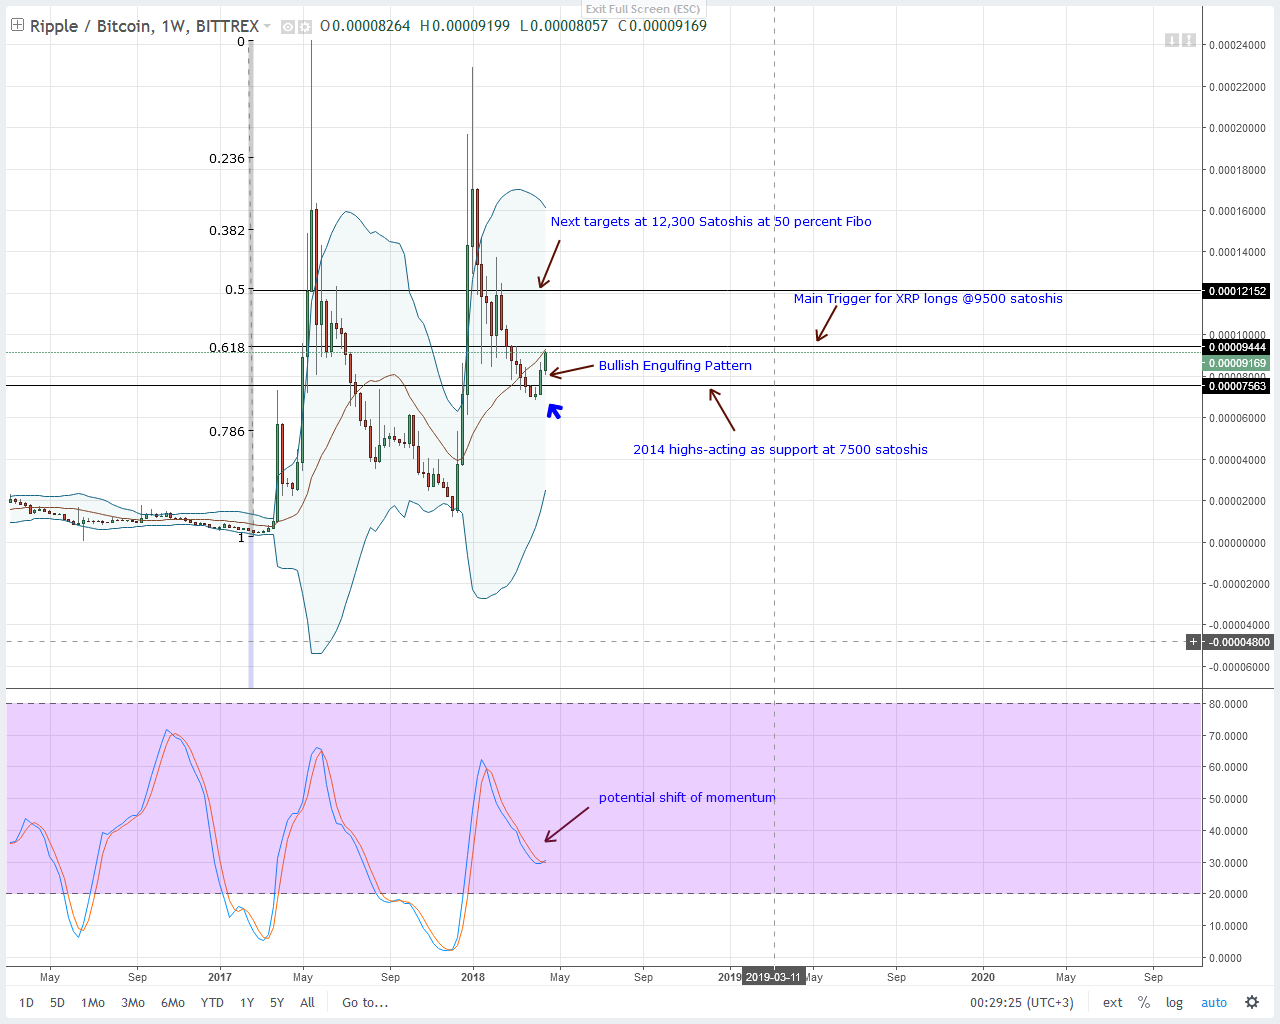
After this week, one thing would be certain: the confirmation of Ripple bullish pressure would be complete. From Ripple investors’ point of view, that would be welcomed news. Fact is buyers are now testing key resistance levels-the middle BB and the 61.8 percent Fibonacci retracement which anchors on Ripple all time high lows.
However, what’s critical for us is that shift of momentum as the stochastics shows. Ripple acts like a security and even though it is inherently designed to be stable to facilitate cross border transfers, odds of further gains is high.
Any surge past 9500 Satoshis and we might consider tests of 12,300 Satoshis at the 50 percent Fibonacci retracement levels in the coming weeks.
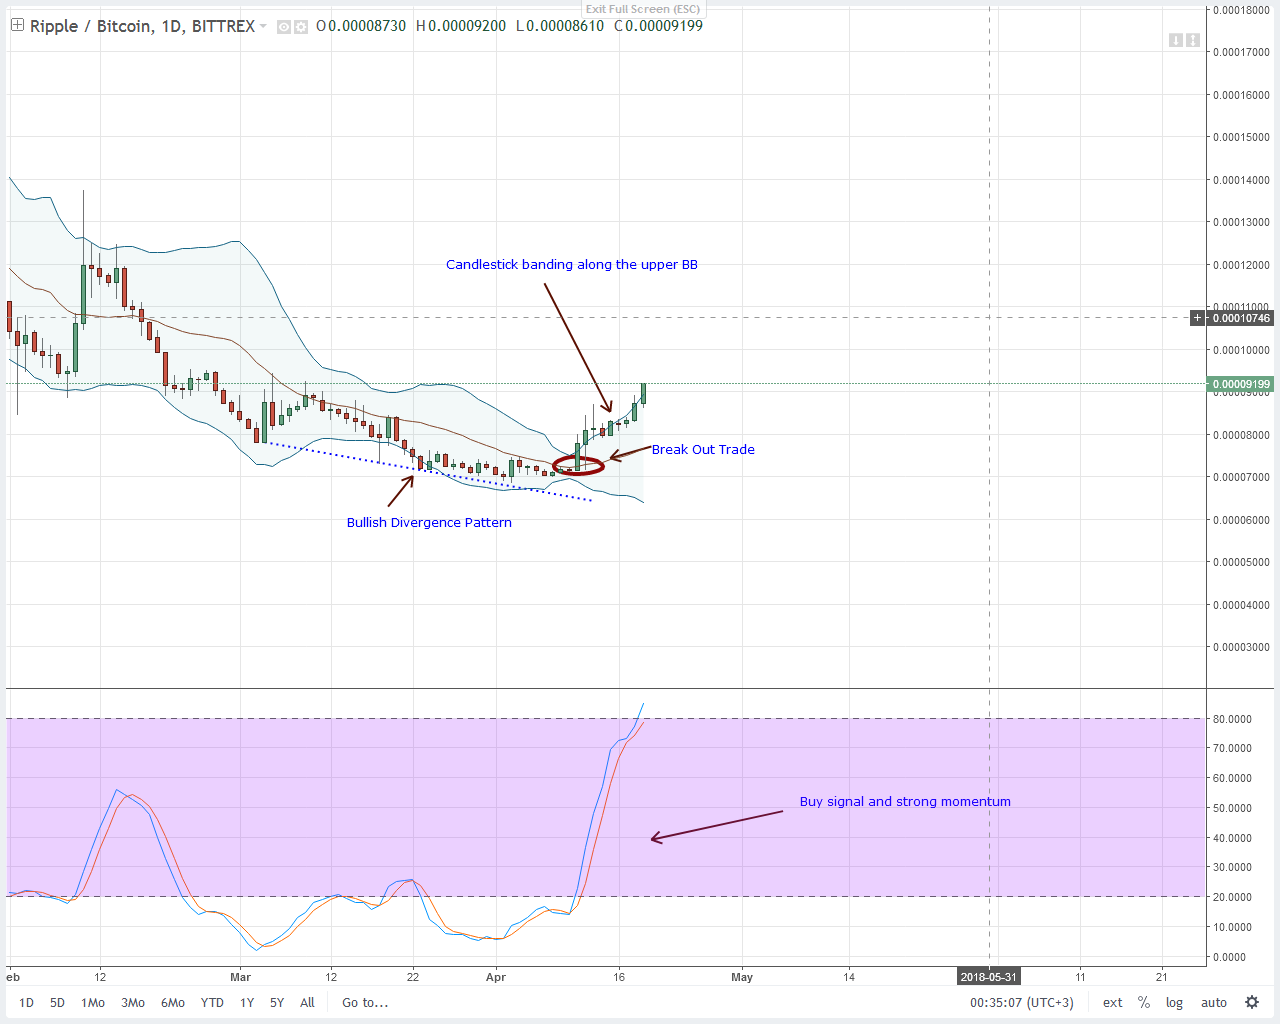
It’s apparent that Ripple bulls are stepping on the gas pedal and racing in the daily chart. In my view, this was inevitable especially following that bullish break and close above the main resistance trend line on April 11.
Then not only did Ripple bulls surge but this was accompanied by favorable shift of momentum because of that stochastic buy signal turning from oversold territory. I forecast further appreciation as prices begin to band along the upper BB. As such my first target is at 12,300 Satoshis.


Bitcoin’s Value Climbs Above $71,000 Ahead of Impending Halving Event

Best Bitcoin Miners in 2024

BlockDAG’s Visionary Leap: Sparking a Crypto Revolution with 5000% ROI Potential

Earn Passive Income Quickly with ARKMining Cloud Mining – Daily Profits

Bitcoin Boom vs China’s Ban: Investors Caught in Crossfire

BlockDAG’s Visionary Leap: Sparking a Crypto Revolution with 5000% ROI Potential
BlockDAG’s groundbreaking announcement has stirred a wave of excitement in the cryptocurrency community, following its keynote presentation broadcasted across the...

Earn Passive Income Quickly with ARKMining Cloud Mining – Daily Profits
ARKMining, a leading cloud mining platform, recently released a complete analysis report demonstrating its potential to help individuals easily earn...

Top Crypto Altcoins of 2024: SHIB, MK, and BDAG – Unlock Your Path to Growth and Profit
The best crypto altcoins of 2024, according to top crypto analysts are Shiba Inu (SHIB), Meme Kombat (MK), and BlockDAG...

Insiders Reveal: BlockDAG’s Presale Poised for 50X Boom with Possible Bitcoin Breakout on the Way; BTCMTX Presale Set to End
The Bitcoin rally may still have room for further growth following a recent breakout. However, increased Bitcoin volatility could occur,...


Wizarbit – Quick Bitcoin Purchase with Credit Card
In the fast-paced world of cryptocurrency, convenience and speed are paramount. Wizarbit emerges as a trailblazer in facilitating swift Bitcoin...
