Technical Analysis
Technical Analysis XRP/USD 12/11/2017
In the technical analysis a few days ago, I was saying that I expect a correction on Bitcoin. This correction is underway and the Bitcoin price now is 6280 USD. Bitcoin’s first support is in the 5900 USD area. The market is a bit scrambled at the moment. The fact that the SegWit did not happen has unpleasantly surprised many of those who were hoping for a new currency in their own portfolio.
The fact that the SegWit did not take place, changes the fundamental data of Bitcoin. It has a lot of transactions awaiting validation, and the transfer fee is quite high. Will this be the point where King Bitcoin will begin his decline and the new King Bitcoin Cash will take its place? This is not a neglected hypothesis. I suggest you make your own research on these new challenges from Crypto Market.
The resistance lines are: The support lines are:
R1 – 0,23usd S1 – 0,19usd
R2 – 0,30usd S2 – 0,17usd
S3 – 0,15usd
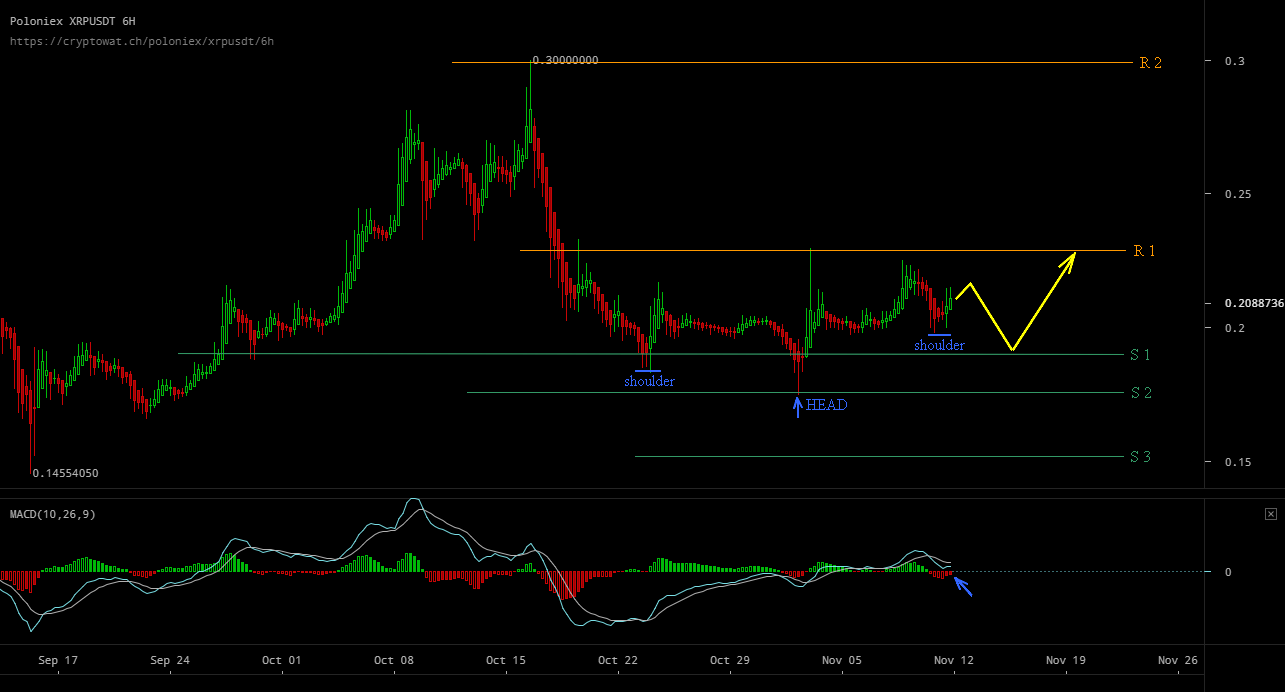
The XRP / USD parity also dropped under the influence of the Bitcoin correction. The decrease on XRP/USD was quite low, as compared to other currencies. XRP/USD did not fall below the support area S1 0,19 USD, which is a sign of stability. As you can see on the graph, we have a pattern head and shoulders (inverse). This type of pattern, announces a trend up.
What can we expect in the next few days? If Bitcoin stops falling from the 5900usd support area, the XRP/USD parity will have a lateral movement in the range between S1 0.19 USD and R1 0.23 USD. The price will again test the resistance area R1 0.23 USD.
If Bitcoin falls below 5900, XRP/USD will break down S1 0.19 USD and will drop to S2 0.175 USD.
The MACD indicator is kept above 0 which is a positive fact. However, he offered a sell signal three days ago when the Bitcoin correction began. At this point, it’s in the red area, but it looks like we will soon receive a new buy signal from it. I recommend you track your own MACD signals (chart 4 or 6 hours) if you are interested in buying XRP/USD.
The probable direction for the next few days is drawn in yellow on the chart.


Bitcoin’s Value Climbs Above $71,000 Ahead of Impending Halving Event

Best Bitcoin Miners in 2024

BlockDAG’s Visionary Leap: Sparking a Crypto Revolution with 5000% ROI Potential

Earn Passive Income Quickly with ARKMining Cloud Mining – Daily Profits

Bitcoin Boom vs China’s Ban: Investors Caught in Crossfire

BlockDAG’s Visionary Leap: Sparking a Crypto Revolution with 5000% ROI Potential
BlockDAG’s groundbreaking announcement has stirred a wave of excitement in the cryptocurrency community, following its keynote presentation broadcasted across the...

Earn Passive Income Quickly with ARKMining Cloud Mining – Daily Profits
ARKMining, a leading cloud mining platform, recently released a complete analysis report demonstrating its potential to help individuals easily earn...


Top Crypto Altcoins of 2024: SHIB, MK, and BDAG – Unlock Your Path to Growth and Profit
The best crypto altcoins of 2024, according to top crypto analysts are Shiba Inu (SHIB), Meme Kombat (MK), and BlockDAG...

Insiders Reveal: BlockDAG’s Presale Poised for 50X Boom with Possible Bitcoin Breakout on the Way; BTCMTX Presale Set to End
The Bitcoin rally may still have room for further growth following a recent breakout. However, increased Bitcoin volatility could occur,...


Wizarbit – Quick Bitcoin Purchase with Credit Card
In the fast-paced world of cryptocurrency, convenience and speed are paramount. Wizarbit emerges as a trailblazer in facilitating swift Bitcoin...

Jonathan
November 13, 2017 at 5:51 am
Great blogpost Ahmadderar, are you a huge fan of Ripple like me ? 🙂
ahmadderar
November 13, 2017 at 2:51 pm
Thank you Jonathan, Yes Of course 🙂