Technical Analysis
Technical Analysis XRP/USD 25/2/2018

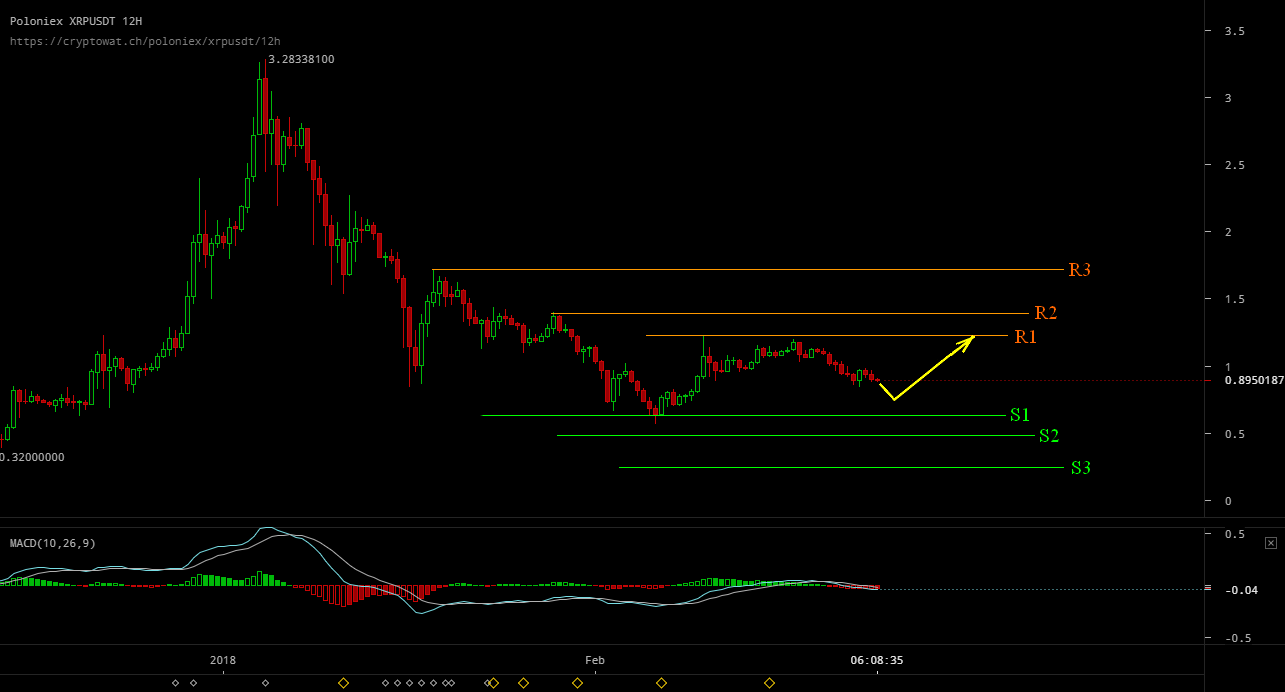
At the time I write this technical analysis, XRP/USD is in a corrective wave. This corrective wave is very important. The current corrective movement will determine whether the market will become a bull in a short time, or whether the consolidation period will take a few months and then become a bull. For the time being, XRP/USD has found strong resistance in the $1.25 area. This area became R1 -$1.25 .
This is also due to the fact that after reaching $11800, Bitcoin began a corrective wave. From TA’s point of view, the corrective movement on Bitcoin is normal. After reaching the downward trendline, Bitcoin began a corrective wave. If Bitcoin stops in the $8000-$9000 zone and then there will be a recovery move completed by breaking down the downline, it will be fine. It will confirm the bull market trend.
Any Bitcoin fall in the $6000-$7000 area will be a weakness, and the bull (short-term) trend will be momentarily invalidated. In this case, consolidation will take some time and a comeback of the bull market may take a few months.
The resistance lines are: The support lines are:
R1 – 1,25 USD S1 – 0,65 USD
R2 – 1,4 USD S2 – 0,50 USD (psychological)
R3 – 1,72 USD S3 – 0,25 USD
What can we expect in the next week?
Considering the scenarios above, on XRP/USD the corrective wave should stop in the 0.70-0.80 USD range. If the corrective wave stops in that area and then there will be a recovery movement with the R1-1.25 USD break, it will be fine. The bull trend will be confirmed on the XRP/USD parity. If XRP/USD will descend in the 0.60 – 0.70 USD area, there will be evidence of weakness, and the return of the bull market may take a few months.
On the 12-hour chart, the MACD is in the positive area (above line 0) but a few days ago a signal to sell appeared. The probable move for the next period is drawn in yellow.
In conclusion of the technical analysis, I will remind you that Cuallix official site was launched the Cuallet tool. Cuallet uses the XRapid and XRP currency in cross-border payments. Basically, this is the first live use of XRP in cross-border payments. The news has not yet been taken over by the news sites on the Internet and the price has not been influenced in any way.


Bitcoin’s Value Climbs Above $71,000 Ahead of Impending Halving Event

Best Bitcoin Miners in 2024

BlockDAG’s Visionary Leap: Sparking a Crypto Revolution with 5000% ROI Potential

Earn Passive Income Quickly with ARKMining Cloud Mining – Daily Profits

Bitcoin Boom vs China’s Ban: Investors Caught in Crossfire

BlockDAG’s Visionary Leap: Sparking a Crypto Revolution with 5000% ROI Potential
BlockDAG’s groundbreaking announcement has stirred a wave of excitement in the cryptocurrency community, following its keynote presentation broadcasted across the...

Earn Passive Income Quickly with ARKMining Cloud Mining – Daily Profits
ARKMining, a leading cloud mining platform, recently released a complete analysis report demonstrating its potential to help individuals easily earn...


Top Crypto Altcoins of 2024: SHIB, MK, and BDAG – Unlock Your Path to Growth and Profit
The best crypto altcoins of 2024, according to top crypto analysts are Shiba Inu (SHIB), Meme Kombat (MK), and BlockDAG...


Insiders Reveal: BlockDAG’s Presale Poised for 50X Boom with Possible Bitcoin Breakout on the Way; BTCMTX Presale Set to End
The Bitcoin rally may still have room for further growth following a recent breakout. However, increased Bitcoin volatility could occur,...


Wizarbit – Quick Bitcoin Purchase with Credit Card
In the fast-paced world of cryptocurrency, convenience and speed are paramount. Wizarbit emerges as a trailblazer in facilitating swift Bitcoin...
