Technical Analysis
XRP Price Analysis: Liquidity Above Resistance
- XRP price is trading horizontally
- Liquidity above resistance
- Look out for stop-loss hunts
1 Hour XRP/USD price chart
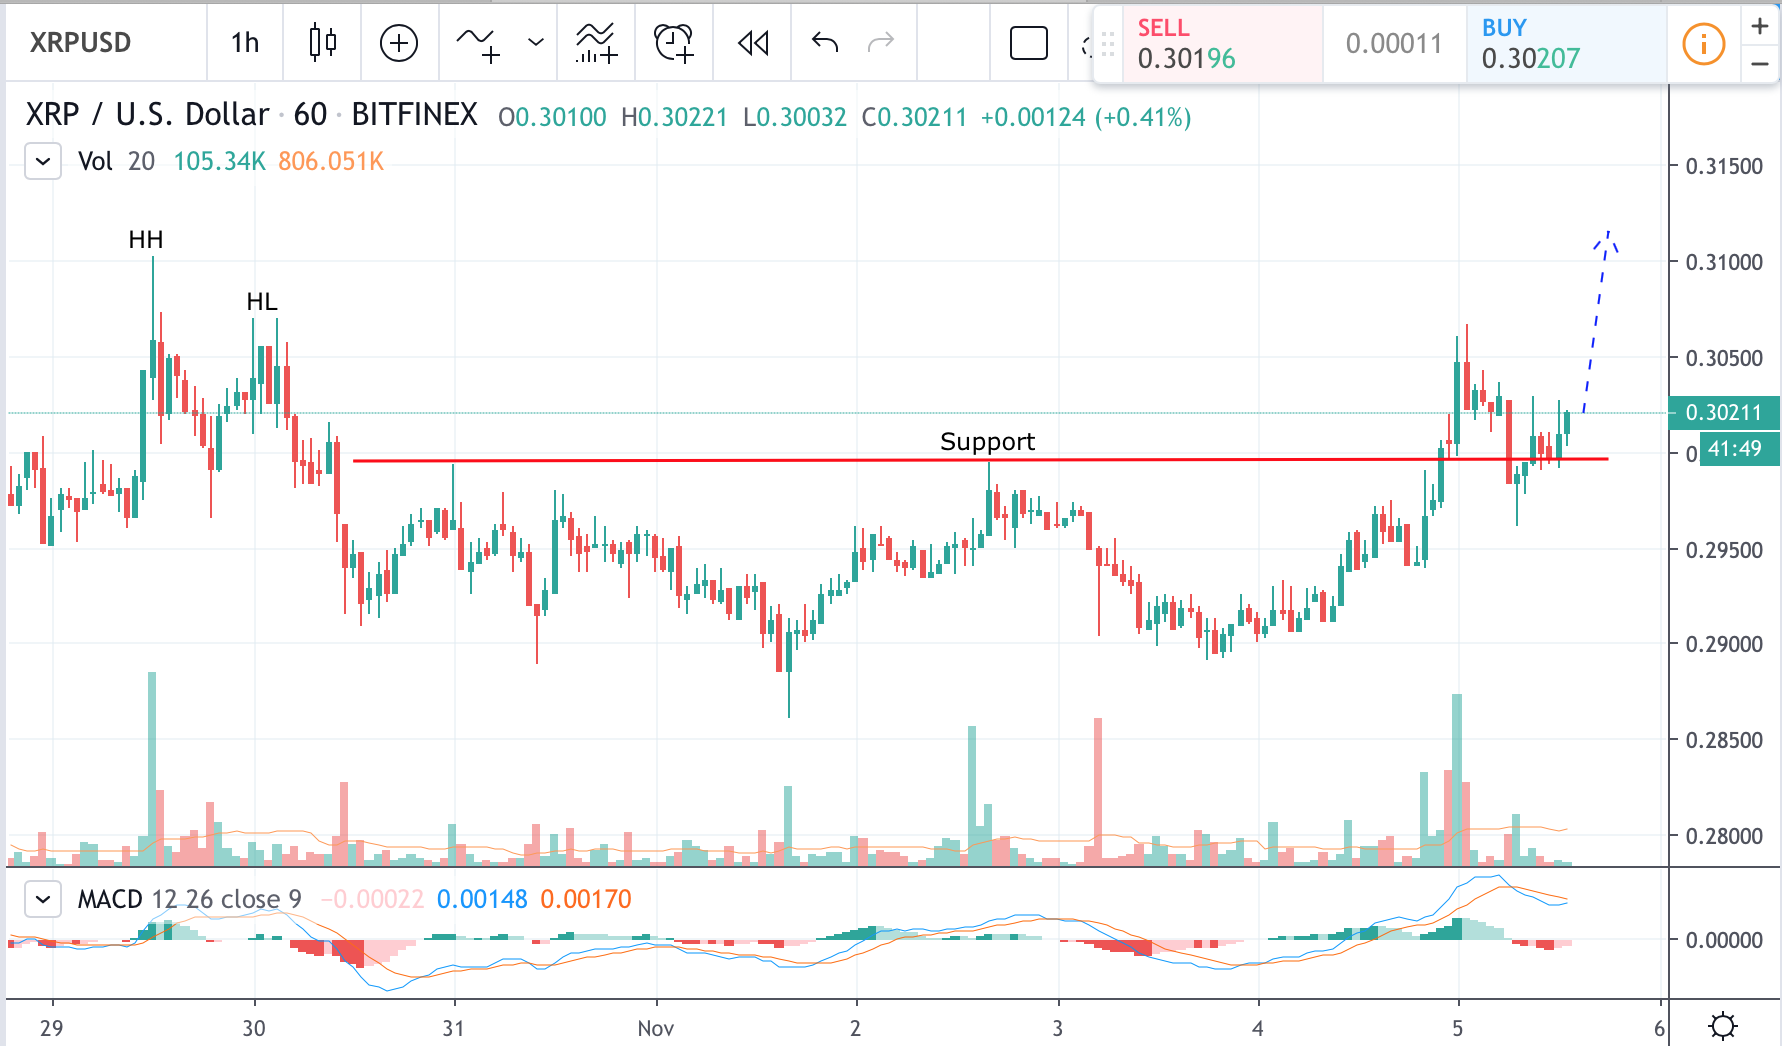
XRP still consolidating within the horizontal trading channel on the 1-hour price chart. After the recent stop loss hunt below $0.27, the price failed to make any significant gains. Trading volumes were average or below the average suggesting falling interest at such price levels.
A few hours ago XRP price set another high at $0.2760, just falling short to reach $0.27650 resistance. That fact suggests we still may witness price going into a liquidity pool above that resistance level. If the move will be supported by momentum and volume price may close somewhere near to the next resistance of $0.285, where more liquidity will be available for traders. It is important to remember that price may just dip into liquidity with immediate pullback trapping stop losses for “short” positions in the process.
Chart source: Tradingview
Disclaimer: Markets, instruments, and advice on this page are for informational purposes only and should not in any way come across as a recommendation to buy or sell in these assets. You should do your own thorough research before making any investment decisions.


Bitcoin’s Value Climbs Above $71,000 Ahead of Impending Halving Event

Best Bitcoin Miners in 2024

BlockDAG’s Visionary Leap: Sparking a Crypto Revolution with 5000% ROI Potential

Earn Passive Income Quickly with ARKMining Cloud Mining – Daily Profits

Bitcoin Boom vs China’s Ban: Investors Caught in Crossfire

BlockDAG’s Visionary Leap: Sparking a Crypto Revolution with 5000% ROI Potential
BlockDAG’s groundbreaking announcement has stirred a wave of excitement in the cryptocurrency community, following its keynote presentation broadcasted across the...

Earn Passive Income Quickly with ARKMining Cloud Mining – Daily Profits
ARKMining, a leading cloud mining platform, recently released a complete analysis report demonstrating its potential to help individuals easily earn...

Top Crypto Altcoins of 2024: SHIB, MK, and BDAG – Unlock Your Path to Growth and Profit
The best crypto altcoins of 2024, according to top crypto analysts are Shiba Inu (SHIB), Meme Kombat (MK), and BlockDAG...

Insiders Reveal: BlockDAG’s Presale Poised for 50X Boom with Possible Bitcoin Breakout on the Way; BTCMTX Presale Set to End
The Bitcoin rally may still have room for further growth following a recent breakout. However, increased Bitcoin volatility could occur,...


Wizarbit – Quick Bitcoin Purchase with Credit Card
In the fast-paced world of cryptocurrency, convenience and speed are paramount. Wizarbit emerges as a trailblazer in facilitating swift Bitcoin...
