Technical Analysis
Technical Analysis XRP/USD 4/11/2017
In the technical analysis a few days ago, I was saying that the chart is uncertain and can not determine a likely direction for the next three days. In recent days, the XRP/USD price has fallen to 0.175 USD (S2). Yesterday evening there was an aggressive upward move, amid large volumes traded. This move up, tested the resistance line R1 0.23 USD. The moment coincided with the appearance of the Palm Beach Confidential Report that recommends buying XRP. I will not insist on this topic, do a research.
For the next period, I expect an important correction on Bitcoin. This will appear for two reasons. It will be a purely technical move, because Bitcoin has grown a lot lately. Secondly, after Bitcoin fork a lot of people, including whales will sell Bitcoin. The dangerous area is 7500-8000 USD. Considering these things, it is possible for XRP/USD to have lower prices and see backed up support areas from 0.17 and 0.15 USD. In conclusion, to buy XRP/USD at good prices, keep an eye on the Bitcoin chart.
The resistance lines are: The support lines are:
R1 – 0,23usd S1 – 0,19usd
R2 – 0,30usd S2 – 0,17usd
S3 – 0,15usd
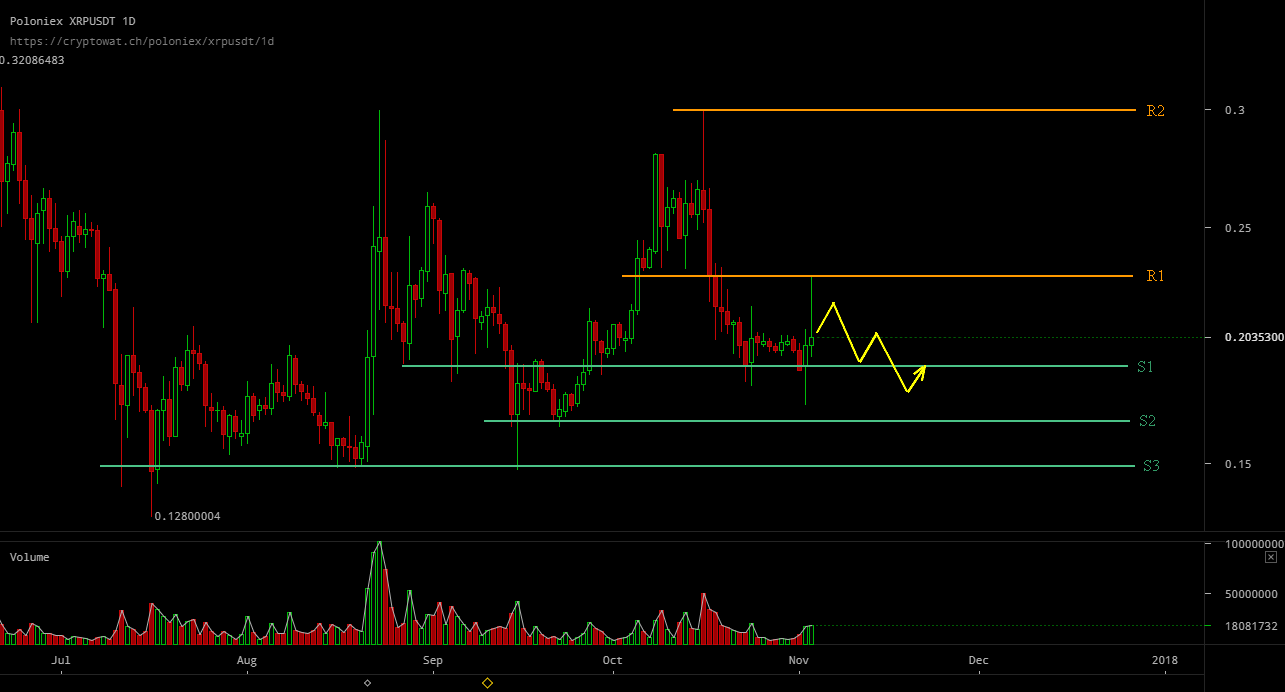
Over the next three days, XRP/USD could again test the resistance of R1 0.23usd. After the price gets close to R1 0.23usd I expect to have a correction. The depth of this correction will also depend on the Bitcoin movement. If the BTC will have a correction, it is possible to test again the support level S2 0,17 USD, or in case of aggressive sales even the main support level (S3 0,15usd).
I would like to say a fact. I do not use for buying or selling, signals given by various indicators (MACD, Stochastic). For me, support or resistance lines are enough to set my entrances or exits. A lot of people, however, use MACD or Stochastic to buy or sell. From now, I will introduce in the technical analysis an indication on the MACD tool (buy, sell). This may be useful for some of us.
On the XRP/USD chart of 4 hours, on Nov. 2, we had a buy signal from the MACD indicator. At the moment, MACD shows us that we are in a new trend up.
The probable direction for the next few days is drawn in yellow on the chart.


Volatility Shares Launches First-Ever XRP Futures ETF On Nasdaq

XRP Has Officially Dethroned Tether Amid $1.2B Korean Volume

Ripple And XRP Receive Global Recognition As Mentioned In IIF’s BIS Response

Whale Alert: Bithumb Receives 20,000,000 XRP From An Unknown Wallet

XRP Futures Open Interest Registers $1B Rise In The Last Week


Solana Blew Up—These 3 Underrated Altcoins Could Be Next in Line for 10,000% Gains!
After Solana’s incredible ascent, the spotlight is shifting to lesser-known cryptocurrencies that might be ready to soar. Three undervalued altcoins...


Under $1 and Primed to 1000x: The Altcoin Solana and Cardano Whales Are Quietly Buying Ahead of the Summer Surge!
Major investors are secretly acquiring a little-known cryptocurrency priced under a dollar, expecting a major surge this summer. Holders of...


Ethereum to $10K? XRP to $7? This New Altcoin Is Forecasted to Outperform Both!
Some analysts predict that major cryptocurrencies like Ethereum and XRP might soon hit impressive new price points. Yet, whispers in...


$TOKERO LevelUP Token is about to take over the crypto market mindshare!
TOKERO LevelUP Token Set to Transform Crypto Exchange Utility Through Innovative Multi-Ecosystem Integration The driving force behind TOKERO's revolutionary hybrid...

STG Energy Cloud Mining Platform: The Wealth Engine for Bitcoin and Solana Investments in 2025
In 2025, the cryptocurrency market is a whirlwind of volatility and opportunity. Bitcoin has dipped below $80,000 due to rumors...
