Technical Analysis
XRP Price in Search for Stop Losses At Both Ends

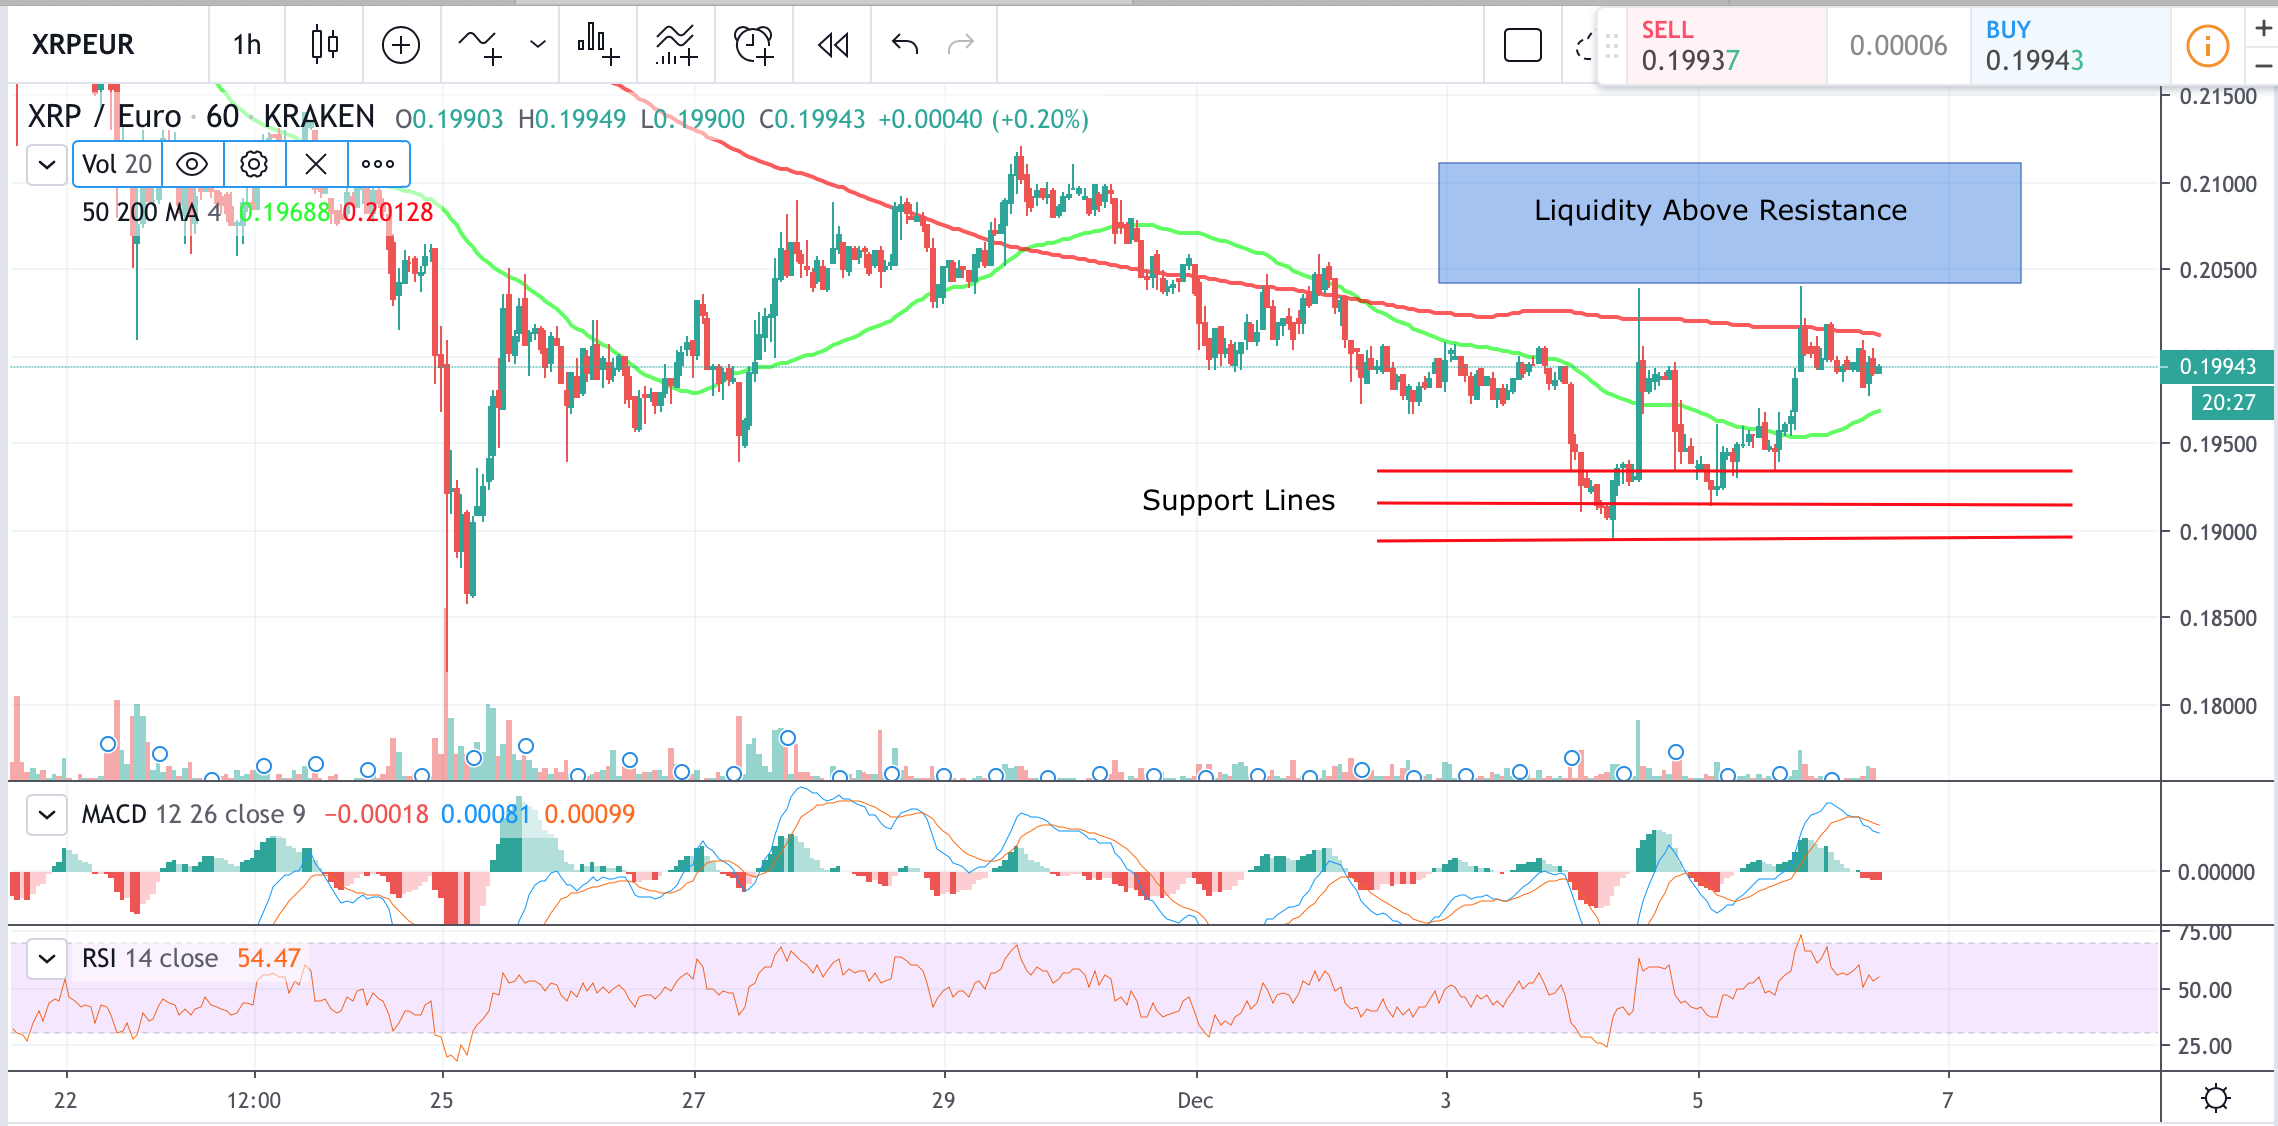
- XRP is trading horizontally
- 50 day MA is below the 200 day MA
- Liquidity zone above the resistance
1 Hour XRP/USD Price Chart

XRP price is trading horizontally after bouncing off the $0.21 support line. The 50-day MA on one hour chart is still below the 200-day MA, coupled with current bearish MACD we can expect the price to drop in the short term. Another bearish indicator, suggesting XRP price decrease is that RSI suggests that XRP was overbought recently. There are several support lines the price may aim at including the closest $0.21500. If the price fails to close well below the $0.21 price mark, the downward move most likely will be a stop loss hunt and thus the XRP price will recover.
Plenty of liquidity above the $0.22700 resistance level may influence the price to move above those levels. However, f0r XRP to really gain bullish momentum the firm close above $0.30 is needed
Chart source: Tradingview
Image source: Needpix.com
Disclaimer: Markets, instruments, and advice on this page are for informational purposes only and should not in any way come across as a recommendation to buy or sell in these assets. You should do your own thorough research before making any investment decisions.


