Technical Analysis
XRP Price Losses 2.5% After Stop Loss Trap Above Resistance.
- XRP price is down by 2.5%
- Stop Loss hunt at the support level
- Possible change of trend if MACD prints bullish crossover
1 Hour XRP/USD price chart
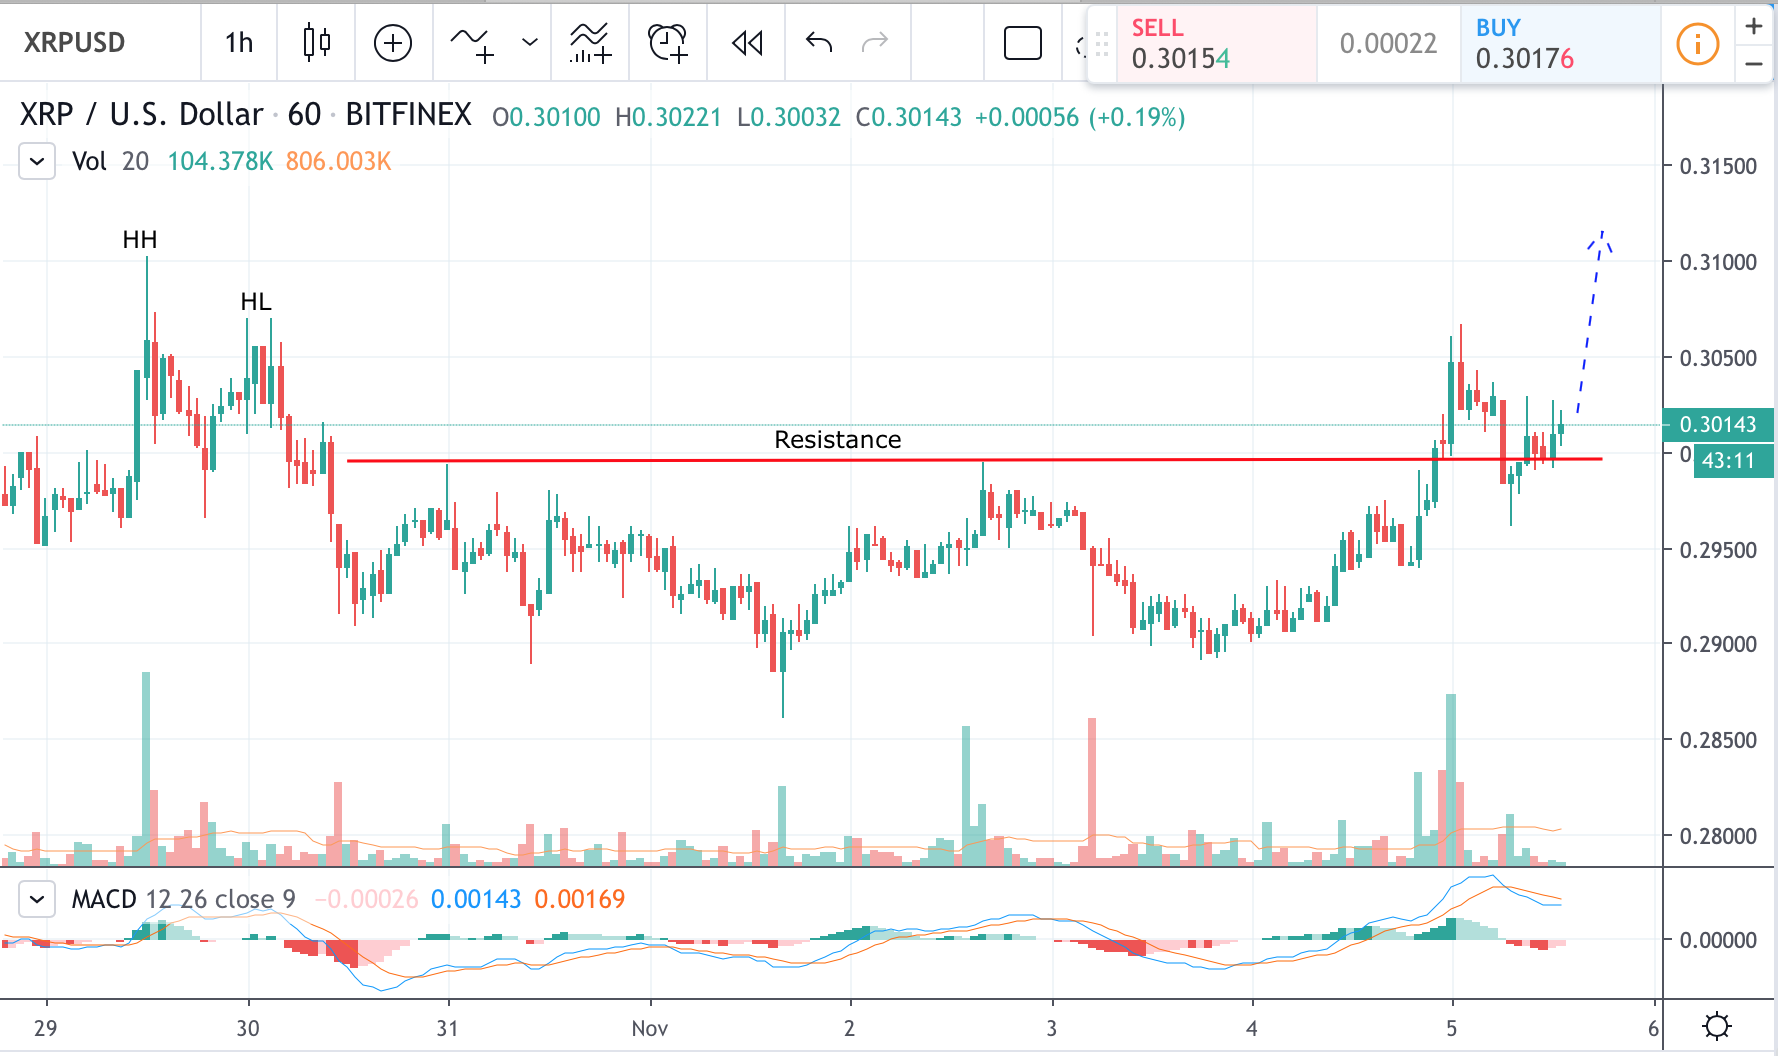
XRP lost 2.5% of its value against the U.S. dollar. After setting a new low at $0.27100 on the 8th of November XRP initiated its recovery. However, the price was going up within the rising wedge formation. Trade volumes were below 20 hours average. Finally, on the 10th of November, the price printed high tail candlestick with a 7x average volume. After such bearish signals, the market reacted and the price went down as low as $0.27050б since then the price retraced slightly suggesting a stop loss hunt below support rather than a genuine downtrend.
At the moment XRP price is consolidating and is yet to print any significant bullish signal. However, MACD indicator on 1-hour chart is showing decreasing bearish pressure so its worth to monitor for crossover into “green”. Few or even one more low tail candlestick may also be a good indicator for the price to reverse and go up.
Chart source: Tradingview
Disclaimer: Markets, instruments, and advice on this page are for informational purposes only and should not in any way come across as a recommendation to buy or sell in these assets. You should do your own thorough research before making any investment decisions.


Ripple (XRP) And Solana (SOL) Set To Lead Altcoin Season: Can ETFSwap (ETFS) Make A 100X Return?

Ripple (XRP), ETFSwap (ETFS), And Ondo Finance (ONDO) Are Leading The Crypto ETF Economy

Ripple CEO Says XRP ETF Is Coming – Here’s How To Position For This Bullish Event

Bitcoin’s Value Climbs Above $71,000 Ahead of Impending Halving Event

Best Bitcoin Miners in 2024
Ripple (XRP) And Solana (SOL) Set To Lead Altcoin Season: Can ETFSwap (ETFS) Make A 100X Return?
Prominent analysts and experts are predicting a soon-to-come surge in the crypto market, and popular altcoins Ripple (XRP) and Solana...
Ripple (XRP), ETFSwap (ETFS), And Ondo Finance (ONDO) Are Leading The Crypto ETF Economy
ETFSwap (ETFS), along with Ripple (XRP) and Ondo Finance (ONDO), is spearheading the dynamic crypto ETF economy, paving the way...
Ripple CEO Says XRP ETF Is Coming – Here’s How To Position For This Bullish Event
Ripple CEO, Brad Garlinghouse, has suggested the possibility of an XRP ETF being approved by governmental authorities soon. He made...


BlockDAG’s Visionary Leap: Sparking a Crypto Revolution with 5000% ROI Potential
BlockDAG’s groundbreaking announcement has stirred a wave of excitement in the cryptocurrency community, following its keynote presentation broadcasted across the...


Earn Passive Income Quickly with ARKMining Cloud Mining – Daily Profits
ARKMining, a leading cloud mining platform, recently released a complete analysis report demonstrating its potential to help individuals easily earn...
