Technical Analysis
Technical Analysis XRP/USD 1/12/2017
Yesterday Bitcoin had a false break up of the psychological area at 10,000 usd. This kind of movement is frequently seen in very volatile capital markets, especially Forex. The fall of Bitcoin from the top 11,440 USD has inevitably led to the fall of the XRP/USD parity. On Bitcoin, the support area number one is at 8,000 USD, and the support area number two is at 6,000 USD. We are currently in a very volatile and uncertain period. We are at a time when we can be caught easily in a bull trap.
Unfortunately, XRP/USD will be closely related to the Bitcoin movement in the coming days. XRP/USD reached a maximum of 0.28usd, then dropped to 0.21 USD. I read the dedicated XRP forums and found that there are many traders who swing on XRP/USD. This currency has become the paradise of daily speculators or swingers. Why is this happening? Because in recent months XRP/USD movements were very predictable. The range of 0.15-0.30 USD has brought great profits.
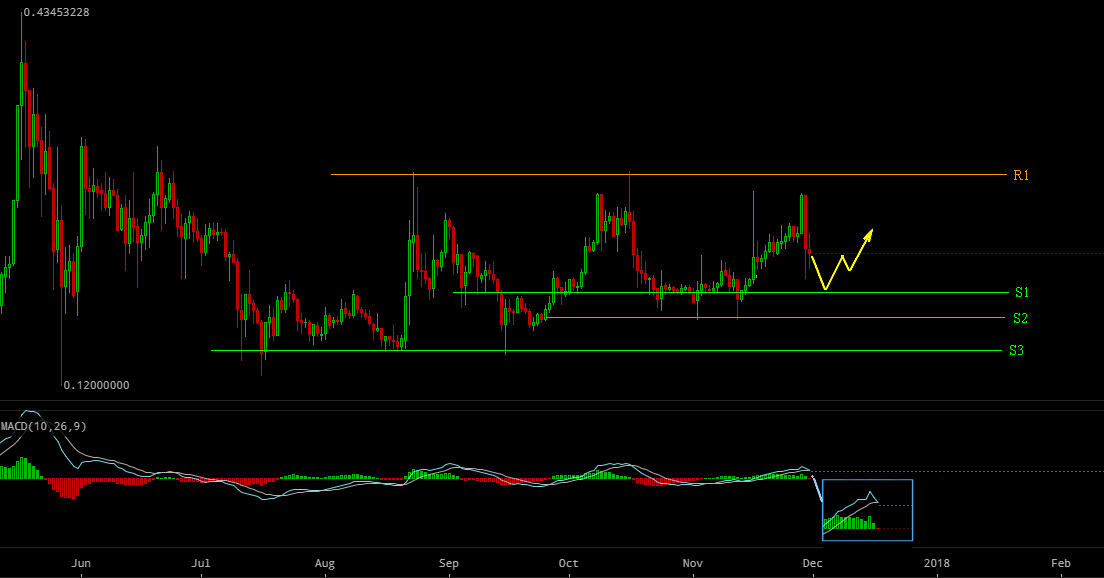
The resistance lines are: The support lines are:
R1 – 0,30USD S1 – 0,20USD
S2 – 0,175USD
S3 – 0,15USD
What can we expect in the next few days?
If Bitcoin’s downward move continues, the XRP/ USD parity will descend to the S1 support area of 0.20 USD. Later we will have a recovery move to the 0.25 USD zone. If negative news appears on Bitcoin, they can create aggressive sales. In this situation, XRP/USD will descend to S2 support area of 0.175 USD. This latest scenario seems less likely at this time. On the MACD Tool (daily chart) we have a sales signal. The probable direction for the next few days is drawn in yellow on the chart.
I would ask you to observe that the XRP/USD parity has been rising in the last few months. On September 15 we had a minimum of 0.145 USD. On November 2 and 12 we had two mins at 0.175 USD. The correctional wave of these days seems to have a bottom in the area of 0.19-0.20 USD. The emergence on a chart of ever-increasing minimums indicates that soon we will have an attempt to break up the resistance area R1 0,30 USD. It remains to see if the development of the corrective wave at this point will stop at 0.19-0.20 USD.


Volatility Shares Launches First-Ever XRP Futures ETF On Nasdaq

XRP Has Officially Dethroned Tether Amid $1.2B Korean Volume

Ripple And XRP Receive Global Recognition As Mentioned In IIF’s BIS Response

Whale Alert: Bithumb Receives 20,000,000 XRP From An Unknown Wallet

XRP Futures Open Interest Registers $1B Rise In The Last Week


Solana Blew Up—These 3 Underrated Altcoins Could Be Next in Line for 10,000% Gains!
After Solana’s incredible ascent, the spotlight is shifting to lesser-known cryptocurrencies that might be ready to soar. Three undervalued altcoins...


Under $1 and Primed to 1000x: The Altcoin Solana and Cardano Whales Are Quietly Buying Ahead of the Summer Surge!
Major investors are secretly acquiring a little-known cryptocurrency priced under a dollar, expecting a major surge this summer. Holders of...


Ethereum to $10K? XRP to $7? This New Altcoin Is Forecasted to Outperform Both!
Some analysts predict that major cryptocurrencies like Ethereum and XRP might soon hit impressive new price points. Yet, whispers in...


$TOKERO LevelUP Token is about to take over the crypto market mindshare!
TOKERO LevelUP Token Set to Transform Crypto Exchange Utility Through Innovative Multi-Ecosystem Integration The driving force behind TOKERO's revolutionary hybrid...

STG Energy Cloud Mining Platform: The Wealth Engine for Bitcoin and Solana Investments in 2025
In 2025, the cryptocurrency market is a whirlwind of volatility and opportunity. Bitcoin has dipped below $80,000 due to rumors...
