Technical Analysis
Technical Analysis XRP/USD 20/03/2018

I wanted to write this technical analysis on Saturday, but I waited until today to see how the graphic formations develop on the XRP/USD parity but also on Bitcoin. So how do we stay? Well, Bitcoin seems to have had a higher minimum (7250 USD) than the previous minimum (6000 USD).
I said, “seems to have a higher minimum,” because we need a recovery move to 12,000 USD to be convinced it was a new higher minimum. If this is confirmed and the next week we will climb to 12,000 USD, that means we are in the formation, a triangle ascending (bull pattern.) Theoretically, considering the news yesterday, I would have all chances that Bitcoin will climb to 12,000 USD .
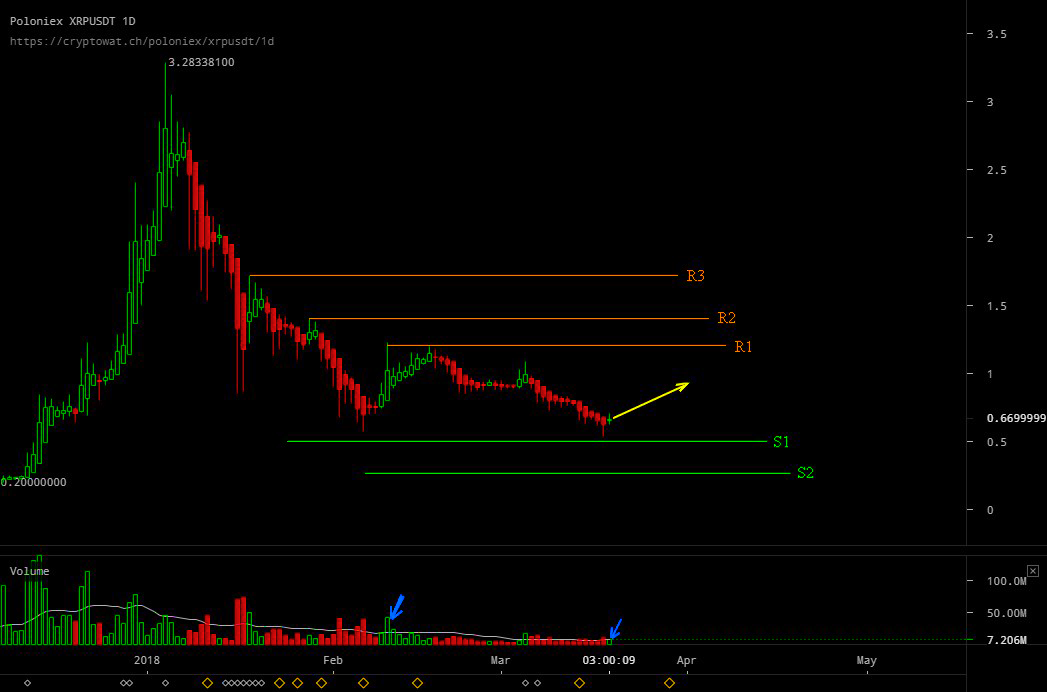
Now let’s move on to the main purpose of this analysis, the XRP/USD parity. On XRP/USD the psychological support level of 0.50 usd was confirmed. Specifically, it is for the second time when we reach $0.55 and there is a rejection up. This level will be an important support in the future. Of course, it will not be impenetrable. It can be broken down in the future if the situation is extremely negative on Bitcoin, or if there is a negative news from Ripple.
The resistance lines are: The support lines are:
R1 – $ 1,25 S1 – $ 0,55 (psychological)
R2 – $ 1,4 S2 – $ 0,25 usd
R3 – $ 1,72
What can we expect in the next week?
If Bitcoin will climb to 12,000 USD, XRP/USD probability for this week is one up to 1 USD. Still, I have a doubt. The doubt is related to the fact that the volumes traded on Sunday evening and on Monday, although bigger than the ones recently are not enough so that the price will rise up to 1 USD. Will this change, or will we float in the range of $ 0.50-0.70 for a long time? We will see.
In closing, the technical analysis will give you a thought to think about. Is not it strange, how did the good news appear at the right moment to save Bitcoin and Crypto Market from a collapse and lower than the previous minima?


