Technical Analysis
Technical Analysis XRP/USD 7/12/2017
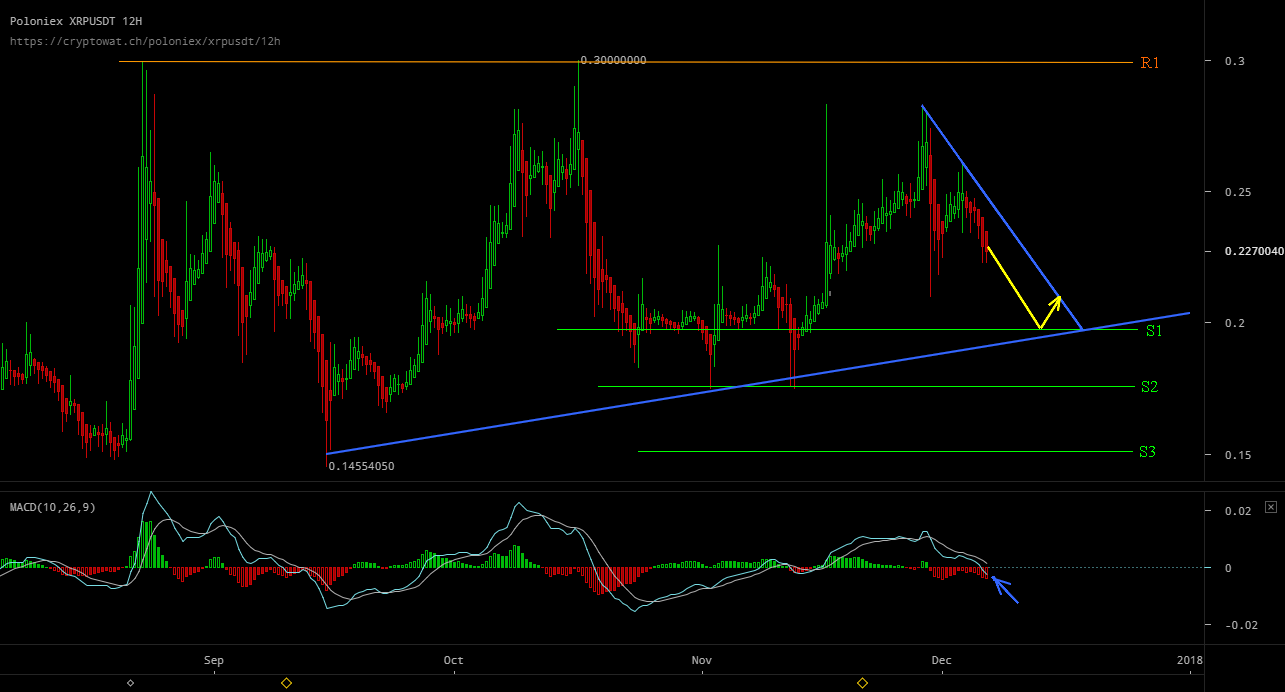
The XRP/USD parity has shifted over the past few days, within the limits set out in the latest technical analysis. The bottom value was even higher than we expected. I had thought that the fall would stop at the support line S2 0.20 USD. The bottom point was at 0.21 USD. As you can see on the graph, we have an ascending trend line drawn in blue. At the same time in the upper part, we have a descending trend line with blue. At this point, we have a symmetrical triangle pattern on the chart. Symmetrical triangular patterns are formed when there is indecision on the market. Soon there will be a symmetrical triangle break. Unfortunately, the symmetrical triangle does not tell us the direction in which the breakage will occur.
The resistance lines are: The support lines are:
R1 – 0,30usd S1 – 0,20usd
S2 – 0,175usd
S3 – 0,15usd
What can we expect in the next few days?
In order to increase R1 to 0.30 USD, the descending trend line must be broken. For the next few days, we will have a downward motion testing the S2 0.20 USD support line. In that area, we have a double support represented by the support line S2, but also by the upward trend line. From this area, we will have a rejection upwards. If we keep on the trend line, the upward trend is good. We can hope for a lateral or slightly increasing movement in the next period. Although this scenario is less likely at this time, we can not rule out the possibility of breaking the double support in the 0.20USD area. Breaking up the upward trend line would drop us back to the minimum zone of 0.15-0.175USD and would be a weakness of XRP/USD.
The MACD indicator is kept in the red (sold) area. Also, the signal lines are approaching the neutral zone 0. This indicates weakness and a downward trend. The probable direction for the next few days is drawn in yellow on the chart.
On Crypto Market, FOMO and lack of experience lead to serious trading mistakes. Take care of other coins that are bubbles. Buying them at this time can be a very bad decision.


Volatility Shares Launches First-Ever XRP Futures ETF On Nasdaq

XRP Has Officially Dethroned Tether Amid $1.2B Korean Volume

Ripple And XRP Receive Global Recognition As Mentioned In IIF’s BIS Response

Whale Alert: Bithumb Receives 20,000,000 XRP From An Unknown Wallet

XRP Futures Open Interest Registers $1B Rise In The Last Week


Solana Blew Up—These 3 Underrated Altcoins Could Be Next in Line for 10,000% Gains!
After Solana’s incredible ascent, the spotlight is shifting to lesser-known cryptocurrencies that might be ready to soar. Three undervalued altcoins...

Under $1 and Primed to 1000x: The Altcoin Solana and Cardano Whales Are Quietly Buying Ahead of the Summer Surge!
Major investors are secretly acquiring a little-known cryptocurrency priced under a dollar, expecting a major surge this summer. Holders of...


Ethereum to $10K? XRP to $7? This New Altcoin Is Forecasted to Outperform Both!
Some analysts predict that major cryptocurrencies like Ethereum and XRP might soon hit impressive new price points. Yet, whispers in...


$TOKERO LevelUP Token is about to take over the crypto market mindshare!
TOKERO LevelUP Token Set to Transform Crypto Exchange Utility Through Innovative Multi-Ecosystem Integration The driving force behind TOKERO's revolutionary hybrid...

STG Energy Cloud Mining Platform: The Wealth Engine for Bitcoin and Solana Investments in 2025
In 2025, the cryptocurrency market is a whirlwind of volatility and opportunity. Bitcoin has dipped below $80,000 due to rumors...

Irogbele S. Chidozie
December 8, 2017 at 7:52 pm
Hello Ahmad,
I am in Africa and need to buy XRP immediately. Could you please point me in the right direction of trustworthy websites? The internet is rife with scammers and I wouldn’t want to fall prey. Thanks