Technical Analysis
Ripple Price Technical Analysis XRP/USD 12/10/2018

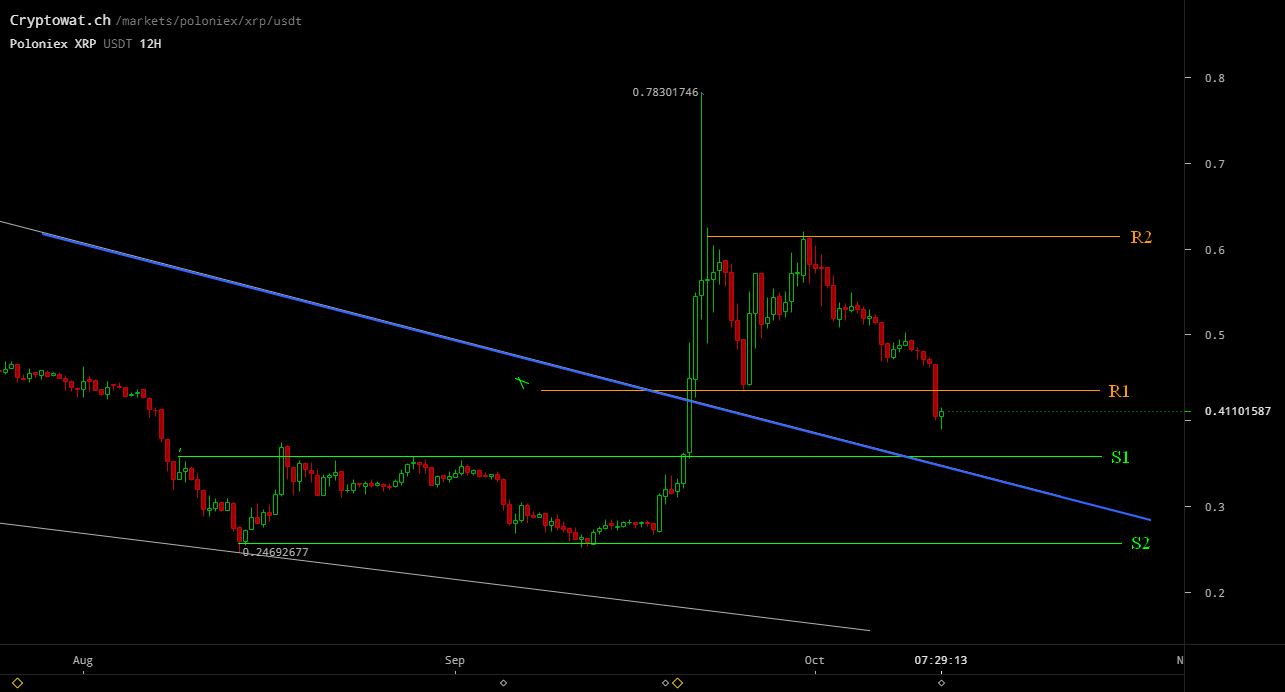
The XRP / USD price ranged from last week’s technical analysis forecast (range between 0.42 and 0.60usd). The exception is yesterday, when a small correction of the Bitcoin price, XRP / USD price dropped to 0.39 USD. The S1-0.42 usd was broken down and transformed into a resistance area (R1 – 0.42 usd).
Part of this corrective move is due to the fact that many short-term speculators have decided to mark their profit and have sold somewhere in the range of 0.50-0.60 USD. Subsequently, this corrective move was transformed into a panic sale amid a drop in the Bitcoin price.
XRP/USD – lines of resistance : XRP/USD – lines of support:
R1 – 0,45 usd S1 – 0,36 usd
R2 – 0,60 usd S2 – 0.25 usd (bottom)
R3 – 1 usd (psychological)

What will happen on XRP / USD next week?
Do not forget that any massive increase in price is followed by a correction. A big increase will be followed by a big correction. It is normal to be so. The area at 0.42 usd has been transformed into a resistance area (R1 – 0.42 usd). For the next week, we have two possible scenarios:
1. The next area where the price can be stopped is the support from S1-0.36 USD. If the Bitcoin price drops to 6000 USD, XRP / USD price will drop to 0.36 USD. This area is likely to be crashed down on panic sales. However, we should not forget that XRP / USD came out of the bear market. In the long run, the 0.28-0.30 usd area will represent the next bottom zone (lower higher). It is quite unlikely that the price drops to the previous bottom zone from 0.25 usd.
2. Still, soon Bitcoin will have a move up, which will mark the end of the bear period. Undoubtedly Bitcoin is preparing for a break up of the descending trend line. This would mean an appreciation of the XRP / USD price. In this situation, the XRP / USD price could have a recovery and we could again reach the 0.50 -0.60 USD range.


