Technical Analysis
Technical Analysis XRP/USD 17/2/2018

XRP / USD is trading over 1 USD. The forecast from the last technical analysis has not been fulfilled. But the forecast from the technical analysis of 02.02.2018 was met. That’s where we said that after XRP / USD will go down to 0.65 USD, an aggressive recovery will take place in the 1-1.2 USD area. XRP / USD fell down to 0.55 USD after aggressive recovery to 1.24 USD. Falling wedge pattern has been broken up, and that’s fine. Part of this recovery move was due to the return of Bitcoin quotes, but there was also an independent move where XRP / USD gained about 40% a day.
I was saying last time that a positive divergence appeared on the XRP / USD chart. What this means? A positive divergence tells us that the bear market is tired and soon will begin a consolidation period, followed by a bull market. Note on the chart that the XRP / USD price continued to have a slight downward trend, while the MACD may see a slightly upward trend. The same move can be seen on the RSI tool. At this point I have serious reasons to believe that the bottom point (0.55 USD) was reached on XRP / USD.
The resistance lines are: The support lines are:
R1 – 1,4 USD S1 – 0,65 USD
R2 – 1,72 USD S2 – 0,50 USD (psychological)
R3 – 2,25 USD S3 – 0,25 USD
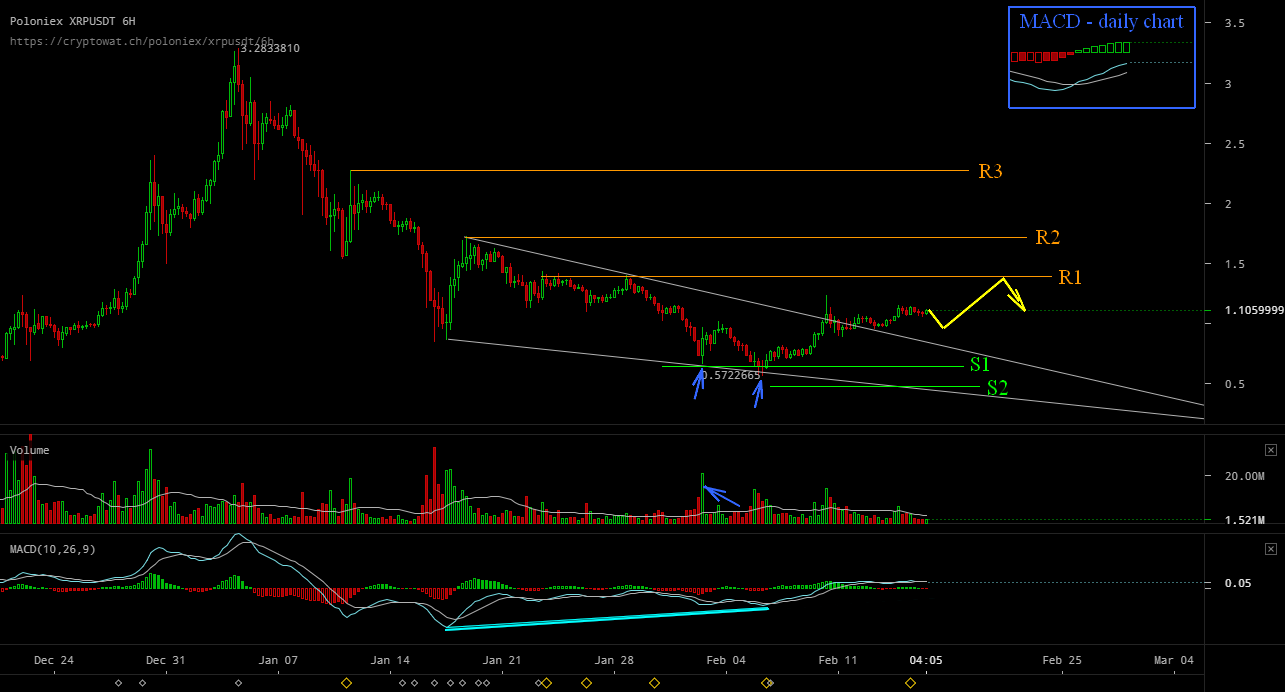
What are the arguments in support of this statement? Notice the chart (the blue arrow on the left) as the first floor (0.65 USD) traded volumes were quite high. Later I had the second bottom (0.55 USD). This pattern is called the double bottom and is a trend reversal pattern. In the right corner we have a first MACD tool on a daily chat. There it can be seen that it gave a clear signal of buy, a few days ago. I also think that Bitcoin has reached the bottom point (6000 USD). The volumes traded in that price range were huge, and usually a bottom point is characterized by huge volumes.
We should be realistic and aware that the consolidation period that follows will also have periods of correction. As I write the technical analysis, Bitcoin struggles to break up the psychological resistance from 10500 USD. We will see if it will exceed 10500 USD now, or after a small correction.
What can we expect in the next week?
XRP / USD seems pretty stable in the 1 USD area. The first major resistance area is S1- 1.4 USD. Whether or not the price will have a small correction to 0.80-0.90 USD or not, I expect in the next period to test R1 – 1.4 USD. The probable move for the next period is drawn in yellow.
On XRP / USD, I’ve had some positive news lately. Also, XRP has been added to trading on a few exchanges. These news as well as other news that will come in the following period will have a cumulative effect, and at one point the XRP / USD will climb to the previous maximum of 3.6 USD. I’m not surprised that this will happen soon, but the price will always follow the very good fundamentals of Ripple. In the absence of really great news the move to the previous maximum of 3.6 USD, may take months.


Volatility Shares Launches First-Ever XRP Futures ETF On Nasdaq

XRP Has Officially Dethroned Tether Amid $1.2B Korean Volume

Ripple And XRP Receive Global Recognition As Mentioned In IIF’s BIS Response

Whale Alert: Bithumb Receives 20,000,000 XRP From An Unknown Wallet

XRP Futures Open Interest Registers $1B Rise In The Last Week

Solana Blew Up—These 3 Underrated Altcoins Could Be Next in Line for 10,000% Gains!
After Solana’s incredible ascent, the spotlight is shifting to lesser-known cryptocurrencies that might be ready to soar. Three undervalued altcoins...

Under $1 and Primed to 1000x: The Altcoin Solana and Cardano Whales Are Quietly Buying Ahead of the Summer Surge!
Major investors are secretly acquiring a little-known cryptocurrency priced under a dollar, expecting a major surge this summer. Holders of...

Ethereum to $10K? XRP to $7? This New Altcoin Is Forecasted to Outperform Both!
Some analysts predict that major cryptocurrencies like Ethereum and XRP might soon hit impressive new price points. Yet, whispers in...


$TOKERO LevelUP Token is about to take over the crypto market mindshare!
TOKERO LevelUP Token Set to Transform Crypto Exchange Utility Through Innovative Multi-Ecosystem Integration The driving force behind TOKERO's revolutionary hybrid...

STG Energy Cloud Mining Platform: The Wealth Engine for Bitcoin and Solana Investments in 2025
In 2025, the cryptocurrency market is a whirlwind of volatility and opportunity. Bitcoin has dipped below $80,000 due to rumors...
