Technical Analysis
Technical Analysis, XRP/ USD (daily chart)
Usually you are accustomed to a brief technical analysis (prediction for 2-3 days). Today we have prepared a technical analysis on the daily chart. Technical analysis on the daily chart is used to provide an overview of the price. We are trying to have a long-term perspective on the price. The problem of such an analysis is the low predictability rate. The longer the technical analysis interval (daily chart, weekly chart), the less likely it is to provide a likely direction. This analysis gives you information to make you aware of buying, selling and stopping loss.
I should make a few points before starting this analysis. I have noticed that there is confusion between support levels and resistance levels. Support levels are noted on the technical analysis with letter “S”. The support level will always be below the spot price level. The support level will always provide support if the price drops. The resistance level is noted on the technical analysis with the letter “R”. The resistance level will always be above the spot price. The resistance level will always create resistance when the price goes up.
Today we will focus our attention on support and resistance levels (main).
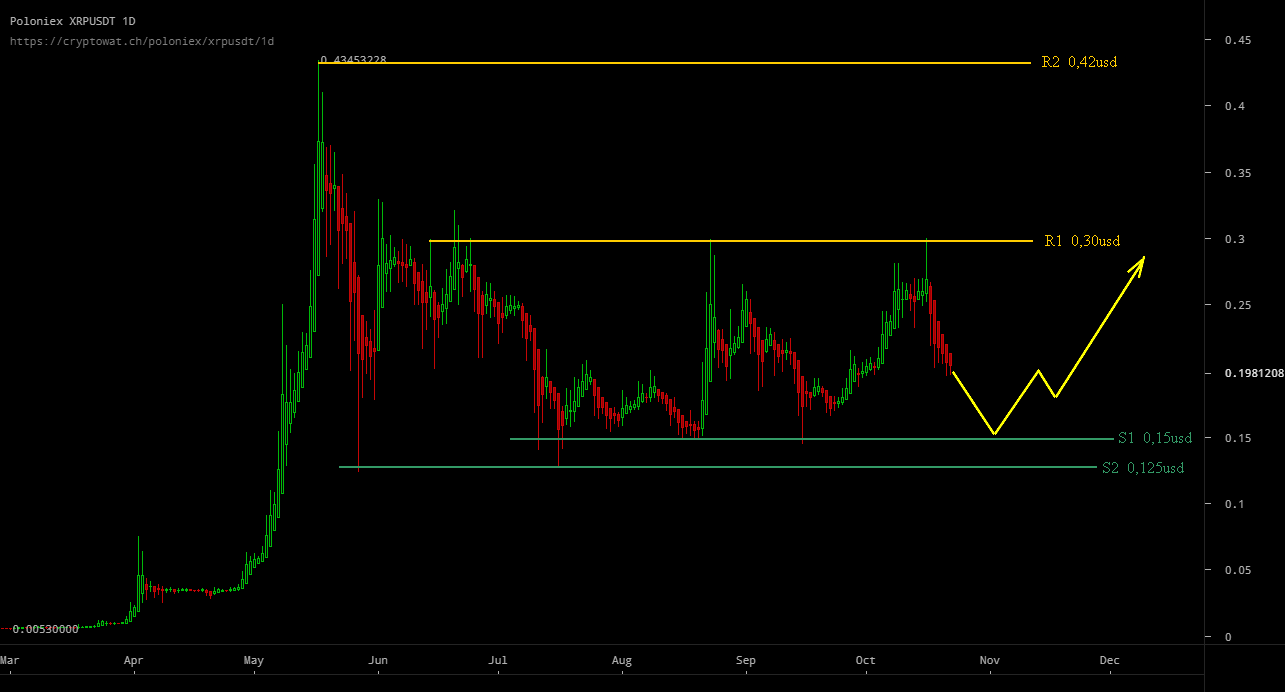
In recent months, XRP/USD has had a ‘range’ evolution. Levels of this evolution in range are S1 0.15 USD and R1 0.30 USD. These levels of support and resistance have been tested many times in the past and have not been broken (or have been broken shortly after a rebound has occurred).
What does the technical analysis of the resistance and support (main) levels tell us? Every new touch of these levels will weaken their resistance. To make everyone understand what this is all about, I’ll give you an example from another field. Each flood of water during a flood will cause the dams to be weakened. After the third or fourth flood, the dam will be broken. We observe that 0.15 USD support levels and 0.30 USD resistance have been achieved many times in the past. This means that these levels of support or resistance will be broken in the coming months. The technical analysis can not foresee exactly how long this will happen. The biggest problem of a technical analysis, especially a daily technical analysis, is the coordinated time.
Let’s analyze under what conditions the support and resistance levels can be broken. The support level S1 0.15 USD can be broken if Bitcoin has a price collapse, or if Ripple gives us negative news. If this level of support is broken you have two options: sell and buy below, or HOLD and buy below. Sometimes selling with a small loss is the best option and sometimes it is the worst option. It is difficult to offer general advice, because it depends on what price you bought XRP and depends on what time horizon you have for this investment. Generally HOLD for years will bring you profit.
If the support level S1 0.15 USD is not broken the price will look up and again test the resistance R1 0.30 USD. So far, the price tested twice at 0.30 USD. At the third or fourth test of this level, it may be broken. There are voices saying that the resistance level of 0.30usd and the previous 0.42usd level will never be exceeded. This is a limited view of the evolution of the XRP/USD price and the evolution of the price of a coin in general. Any trader or experienced technical analyst knows that a level of resistance can not oppose the upward movement of the price for an unlimited time. A level of resistance will be broken under some conditions:
2. High volume traded
3. A small amount of coins put on sale at the resistance level.
Now you have an overview of the XRP/USD parity. I wish you success in trading. Placing your purchase orders near the S1 0.15 USD support area and selling it in the R1 0.30 USD resistance area will bring you great profits. Attention, this up-and-down ride in these price ranges can not last forever. Calculate your buying and selling strategy, taking into account these factors.


Volatility Shares Launches First-Ever XRP Futures ETF On Nasdaq

XRP Has Officially Dethroned Tether Amid $1.2B Korean Volume

Ripple And XRP Receive Global Recognition As Mentioned In IIF’s BIS Response

Whale Alert: Bithumb Receives 20,000,000 XRP From An Unknown Wallet

XRP Futures Open Interest Registers $1B Rise In The Last Week


Solana Blew Up—These 3 Underrated Altcoins Could Be Next in Line for 10,000% Gains!
After Solana’s incredible ascent, the spotlight is shifting to lesser-known cryptocurrencies that might be ready to soar. Three undervalued altcoins...


Under $1 and Primed to 1000x: The Altcoin Solana and Cardano Whales Are Quietly Buying Ahead of the Summer Surge!
Major investors are secretly acquiring a little-known cryptocurrency priced under a dollar, expecting a major surge this summer. Holders of...


Ethereum to $10K? XRP to $7? This New Altcoin Is Forecasted to Outperform Both!
Some analysts predict that major cryptocurrencies like Ethereum and XRP might soon hit impressive new price points. Yet, whispers in...


$TOKERO LevelUP Token is about to take over the crypto market mindshare!
TOKERO LevelUP Token Set to Transform Crypto Exchange Utility Through Innovative Multi-Ecosystem Integration The driving force behind TOKERO's revolutionary hybrid...

STG Energy Cloud Mining Platform: The Wealth Engine for Bitcoin and Solana Investments in 2025
In 2025, the cryptocurrency market is a whirlwind of volatility and opportunity. Bitcoin has dipped below $80,000 due to rumors...

Wayne Hocking
October 25, 2017 at 4:44 am
Thanks mate ya spot on i think, hope it is on a Elliot Wave done it first big wave up. Coming down for 2 then should go up to resistance levels and go past it for 3rd huge wave. As i see it most of the Cryptos are on a wave now.
Teodor Iliev
October 26, 2017 at 5:51 pm
Can you apply the same priciples as in the ordenary fond brose? I mean with bears, bulls, candles and hammers.
Or this is new are were no one knows how to predict something in 100%.
mihaisyblu
October 28, 2017 at 5:38 pm
Technical analysis based on support and resistance areas is among the best technical analysis. The only technical analysis that goes beyond it is technical analysis based on the Elliot Waves. Candles and hammers are used to see the top and bottom points. Often, Candles Star Doji and hammers appear in support and resistance areas. Here’s how things get together. There is nowhere in the world, the technical analysis with 100% prediction. A good technical analysis has an average rate of 70-75% successful prediction. If a technical analyst would achieve a constant 90-95% prediction rate, he would become a billionaire in a few years. There is no such thing anywhere in the world.