Technical Analysis
XRP price analysis. Liquidity pools above resistance lines.
- XRP price is down by 1.5% from $0.25500
- Price looks for liquidity at support and resistance levels
1 Hour XRP/USD price chart
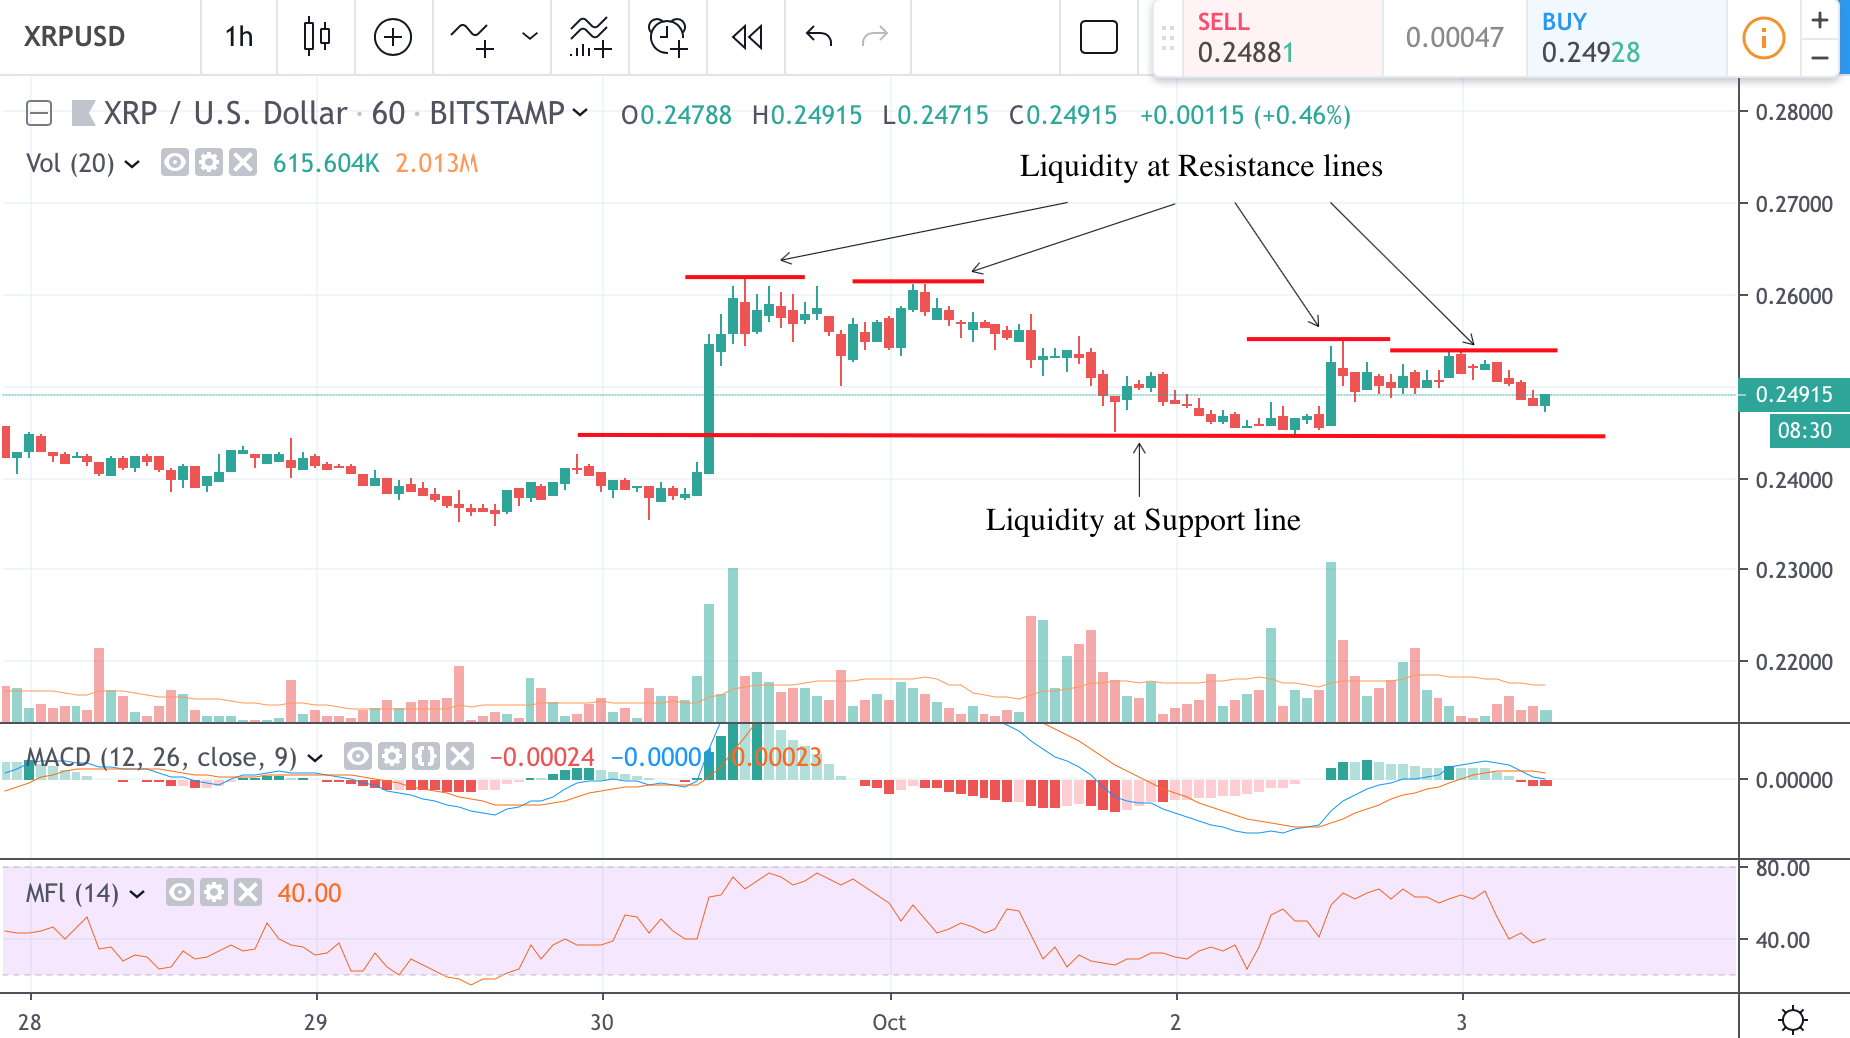
XRP price continues sideways movement and is now fluctuating between the $0.24500 support line and resistance levels above. It is well worth to note that the price has not tappen into any of the liquidity zones above resistance for a while now. On the 30th of September price made a higher high of $0.26150, subsequently $0.25500 and $0.25350 highs were achieved on the 2nd and 3rd of October. It has to be monitored now if price moves above those zones on high momentum or will it merely tap into liquidity pools above those lines in stop-loss hunts.
On the other side of the graph, the price may hunt for long positions below the $0.24450 line. Several more stop-loss hunts at the support level and none at resistance in the short term will be a good indicator of an upcoming price spike.
Chart source: Tradingview
Disclaimer: Markets, instruments, and advice on this page are for informational purposes only and should not in any way come across as a recommendation to buy or sell in these assets. You should do your own thorough research before making any investment decisions. Ripplecoinnews does not in any way guarantee that this information is free from mistakes, errors, or material misstatements. Investing in Cryptocurrencies involves a great deal of risk, including the loss of all or a portion of your investment, as well as emotional distress. All risks, losses, and costs associated with investing, including total loss of principal, are your responsibility.


Ripple CEO Says XRP ETF Is Coming – Here’s How To Position For This Bullish Event

Bitcoin’s Value Climbs Above $71,000 Ahead of Impending Halving Event

Best Bitcoin Miners in 2024

BlockDAG’s Visionary Leap: Sparking a Crypto Revolution with 5000% ROI Potential

Earn Passive Income Quickly with ARKMining Cloud Mining – Daily Profits
Ripple CEO Says XRP ETF Is Coming – Here’s How To Position For This Bullish Event
Ripple CEO, Brad Garlinghouse, has suggested the possibility of an XRP ETF being approved by governmental authorities soon. He made...

BlockDAG’s Visionary Leap: Sparking a Crypto Revolution with 5000% ROI Potential
BlockDAG’s groundbreaking announcement has stirred a wave of excitement in the cryptocurrency community, following its keynote presentation broadcasted across the...

Earn Passive Income Quickly with ARKMining Cloud Mining – Daily Profits
ARKMining, a leading cloud mining platform, recently released a complete analysis report demonstrating its potential to help individuals easily earn...


Top Crypto Altcoins of 2024: SHIB, MK, and BDAG – Unlock Your Path to Growth and Profit
The best crypto altcoins of 2024, according to top crypto analysts are Shiba Inu (SHIB), Meme Kombat (MK), and BlockDAG...

Insiders Reveal: BlockDAG’s Presale Poised for 50X Boom with Possible Bitcoin Breakout on the Way; BTCMTX Presale Set to End
The Bitcoin rally may still have room for further growth following a recent breakout. However, increased Bitcoin volatility could occur,...
