Technical Analysis
XRP price analysis: Loss of bullish momentum?

- XRP is trading in the negative territory down by 0.50%.
- 1 Hour RSI indicator is 41.81
- The current support is $0.25800, resistance is $0.26250
1 Hour XRP/USD price chart
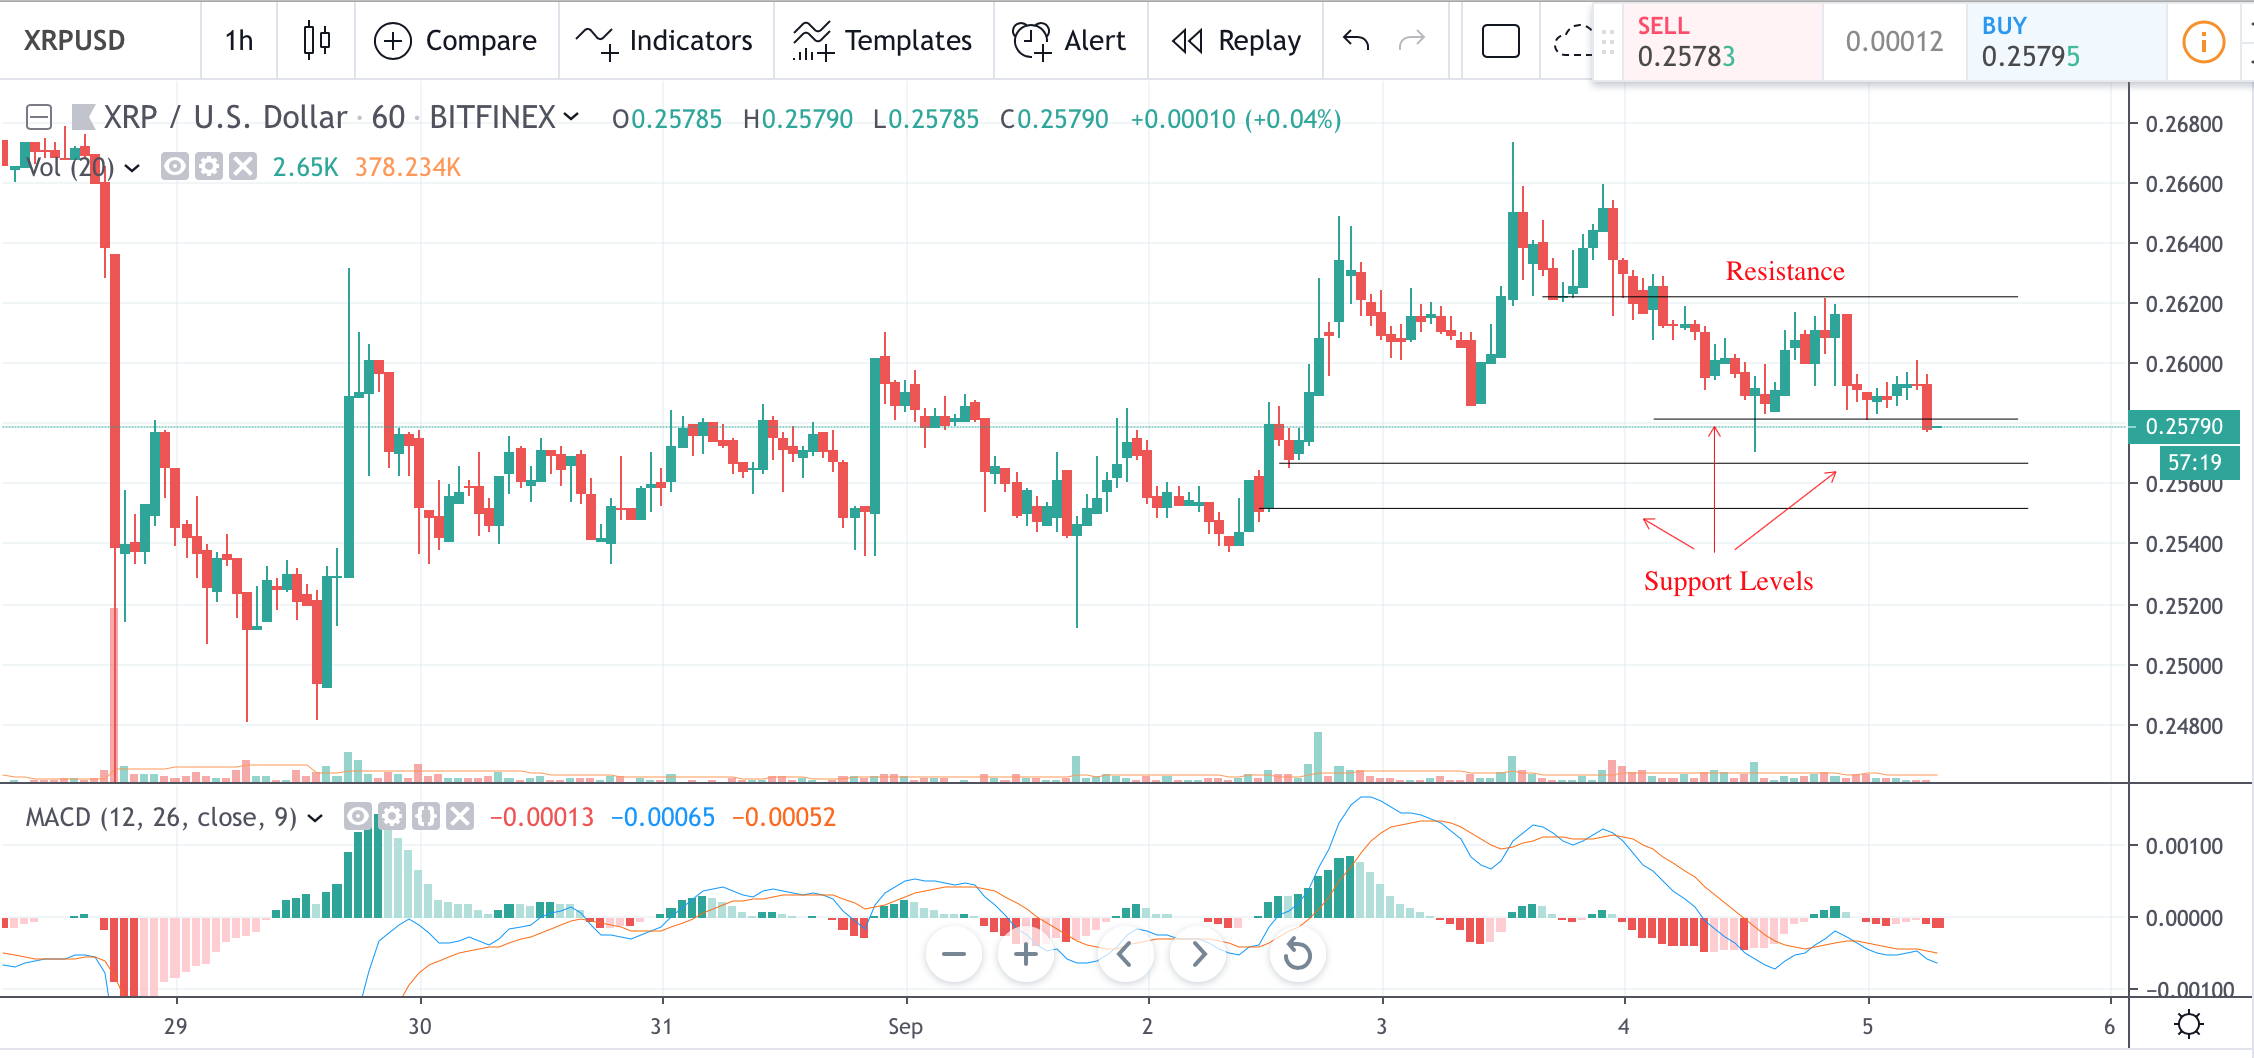
After peaking above $0.26500 XRP failed to sustain that bullish momentum and retraced into consolidation zone. Now XRP price is fluctuating between the resistance – $0.26250 and support – $0.25800. It well worth noting that current support was just broken and its yet to see what direction price will go. If price moves below $0.25650, expect new support to be established at that level. Further bearish pressure may push the price down lower to the next level of support at $0.25500.
However, if the price moves back into the consolidation zone above $0.25800, expect current resistance to be tested yet again.
Chart source: Tradingview
Disclaimer: Markets, instruments and advices on this page are for informational purposes only and should not in any way come across as a recommendation to buy or sell in these assets. You should do your own thorough research before making any investment decisions. Ripplecoinnews does not in any way guarantee that this information is free from mistakes, errors, or material misstatements. Investing in Cryptocurrencies involves a great deal of risk, including the loss of all or a portion of your investment, as well as emotional distress. All risks, losses and costs associated with investing, including total loss of principal, are your responsibility.


Ripple CEO Says XRP ETF Is Coming – Here’s How To Position For This Bullish Event

Bitcoin’s Value Climbs Above $71,000 Ahead of Impending Halving Event

Best Bitcoin Miners in 2024

BlockDAG’s Visionary Leap: Sparking a Crypto Revolution with 5000% ROI Potential

Earn Passive Income Quickly with ARKMining Cloud Mining – Daily Profits
Ripple CEO Says XRP ETF Is Coming – Here’s How To Position For This Bullish Event
Ripple CEO, Brad Garlinghouse, has suggested the possibility of an XRP ETF being approved by governmental authorities soon. He made...

BlockDAG’s Visionary Leap: Sparking a Crypto Revolution with 5000% ROI Potential
BlockDAG’s groundbreaking announcement has stirred a wave of excitement in the cryptocurrency community, following its keynote presentation broadcasted across the...

Earn Passive Income Quickly with ARKMining Cloud Mining – Daily Profits
ARKMining, a leading cloud mining platform, recently released a complete analysis report demonstrating its potential to help individuals easily earn...


Top Crypto Altcoins of 2024: SHIB, MK, and BDAG – Unlock Your Path to Growth and Profit
The best crypto altcoins of 2024, according to top crypto analysts are Shiba Inu (SHIB), Meme Kombat (MK), and BlockDAG...

Insiders Reveal: BlockDAG’s Presale Poised for 50X Boom with Possible Bitcoin Breakout on the Way; BTCMTX Presale Set to End
The Bitcoin rally may still have room for further growth following a recent breakout. However, increased Bitcoin volatility could occur,...
