Technical Analysis
Ripple Price Technical Analysis XRP/USD 14/03/2018

In the last Technical Analysis I was saying that Bitcoin had a positive evolution and the price had broken up the downward trend line. We were then expecting a confirmation that Bitcoin can maintain the descending trend line, thus confirming the bull’s tendency. Bitcoin turned out to be very weak and the price did not keep up the downward trend line. However, the Head and Shoulders pattern is not invalidated. The Head and Shoulders pattern is a bull type. The technical analysis says that in the next period we should have a new wave up to reach the 12,000 usd area and even break it up. Will this happen, or bitcoin will go down to $7500 or even below? In particular, before going up we will have a down? We will see.
The resistance lines are: The support lines are:
R1 – $1,25 S1 – $0,65
R2 – $1,40 S2 – $0,50 (psychological)
R3 – $1,72 S3 – $0,25
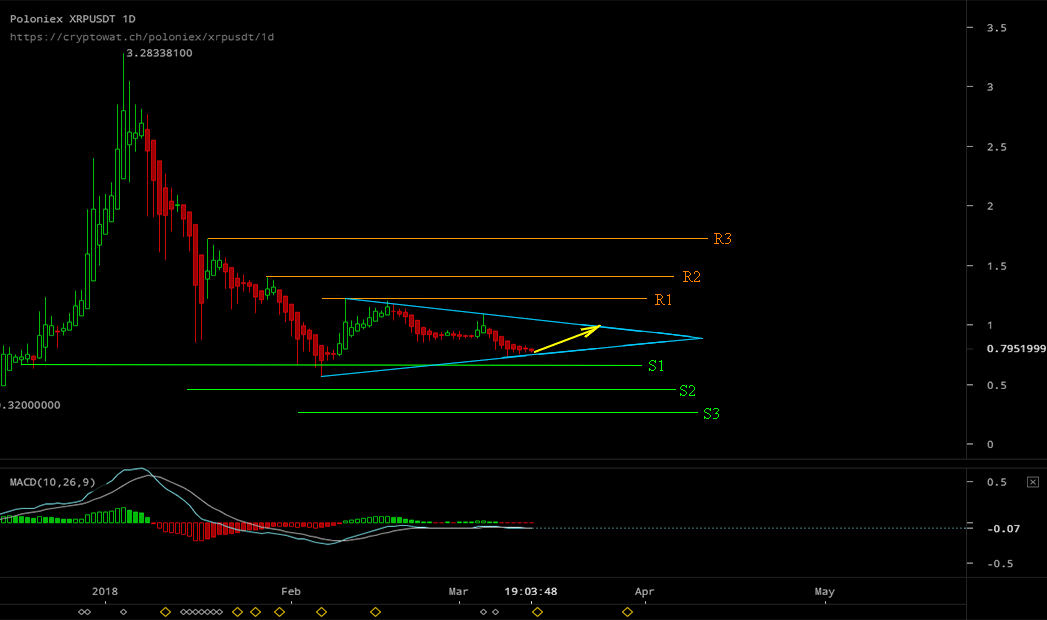
As for XRP/USD, I would like to say something new. Patterns on the chart do not help us. Anyway, we’ll follow Bitcoin’s trend. The technical analysis tells me that it will take some time before we see an important upward move. I see a lot of frustration in the forums regarding the evolution of the XRP and Bitcoin prices.
A trader must be as emotionally emotional as the coins he has in his portfolio. We should accept that Crypto Market has some cycles, and returning after a bear market with approximately 80% drops in some currencies will not occur in a few weeks but in a few months. Many people complain that Ripple had a lot of positive news but the price did not rise. Do not confuse Crypto Market with Stock Market.
Do not worry, the XRP price will increase, only a few months have passed, or a really important news. The technical analysis can not tell us exactly the day when the big growth will take place, but the technical analysis can tell us when we are approaching that moment. Who followed my technical analyzes last year, noticed that starting with November, I said that it would follow a big upward move. I said then that the target price will be 0.70-1 USD. This move began in December and had a maximum of 3.6 USD.
Follow my technical analysis and keep optimists… Remember that whales are as greedy as we are. They are now working on a new consolidation cycle – a bull run. Long-term investors and beginners recommend that they do not stay in front of the computer all day looking at the XRP price. It is best to let you know and watch the price once a week. You can set up an alarm to alert you if there is a big move on XRP.
This week we will have a lateral movement in the range 0.65-1 USD.


Bitcoin’s Value Climbs Above $71,000 Ahead of Impending Halving Event

Best Bitcoin Miners in 2024

BlockDAG’s Visionary Leap: Sparking a Crypto Revolution with 5000% ROI Potential

Earn Passive Income Quickly with ARKMining Cloud Mining – Daily Profits

Bitcoin Boom vs China’s Ban: Investors Caught in Crossfire

BlockDAG’s Visionary Leap: Sparking a Crypto Revolution with 5000% ROI Potential
BlockDAG’s groundbreaking announcement has stirred a wave of excitement in the cryptocurrency community, following its keynote presentation broadcasted across the...

Earn Passive Income Quickly with ARKMining Cloud Mining – Daily Profits
ARKMining, a leading cloud mining platform, recently released a complete analysis report demonstrating its potential to help individuals easily earn...


Top Crypto Altcoins of 2024: SHIB, MK, and BDAG – Unlock Your Path to Growth and Profit
The best crypto altcoins of 2024, according to top crypto analysts are Shiba Inu (SHIB), Meme Kombat (MK), and BlockDAG...


Insiders Reveal: BlockDAG’s Presale Poised for 50X Boom with Possible Bitcoin Breakout on the Way; BTCMTX Presale Set to End
The Bitcoin rally may still have room for further growth following a recent breakout. However, increased Bitcoin volatility could occur,...


Wizarbit – Quick Bitcoin Purchase with Credit Card
In the fast-paced world of cryptocurrency, convenience and speed are paramount. Wizarbit emerges as a trailblazer in facilitating swift Bitcoin...

Robert B. Lewis
March 15, 2018 at 12:03 am
You want to see Bill Gates and Warren Buffet panic and cry like a little girl…just mention Ripple coin. This is proof that anything that may be bigger than they are they try to kill it. I say no one pays any of their taxes this year until Gates and Buffet pay taxes. They don’t pay. They can’t arrest all of us