Technical Analysis
Technical Analysis XRP/USD 9/2/2018
Over the last few weeks, we are witnessing the most aggressive bear market that has taken place over the past few years on the Crypto Market. The maximum decrease observed on XRP/USD was over -80% (0.57 USD). This proves us that Crypto Market was a bubble.
Many have enjoyed those huge increases in 2017 but for the less experienced, joy was later transformed into sadness. Many have sold at a loss, and others have resisted and did not sell, but they are in a virtual loss in their portfolio.
The prediction made last week was not achieved. XRP went down to S2- 0.65 USD but later its recovery was not aggressive and did not go up to 1.20 USD. Against the backdrop of the weakness of the Bitcoin price, XRP/USD failed to get past the psychological level of 1 USD. It is possible that in the coming months, the psychological level of 1 USD will become a strong resistance to rising prices.
The RSI and MACD tools confirm that we are near the end of the bear market. On these instruments, a positive divergence emerged. In the upcoming analysis, I’ll explain exactly what this means.
The resistance lines are: The support lines are:
R1 – 1 USD (psychological ) S1 – 0,65 USD
R2 – 1,72 USD S2 – 0,50 USD (psychological)
R3 – 2,25 USD S3 – 0,25 USD
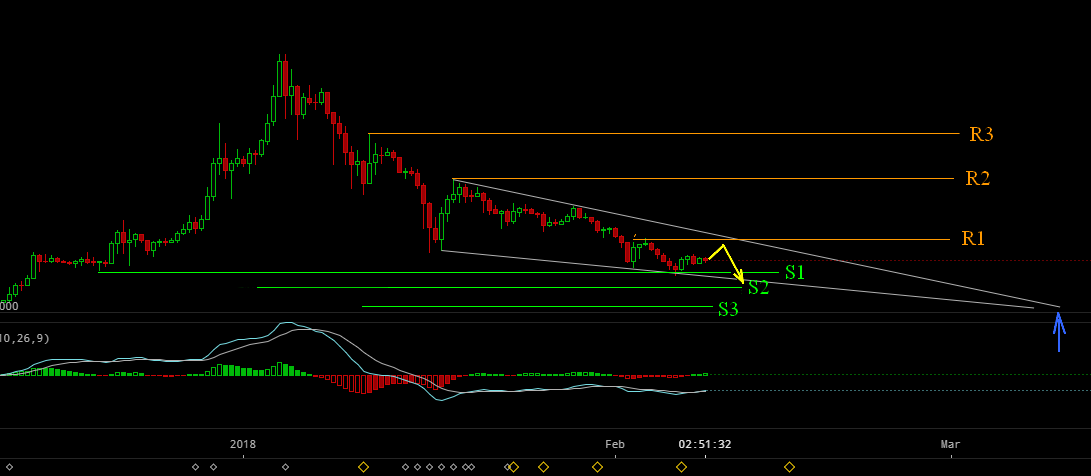
On the chart, a pattern falling wedge was formed. This pattern is a bull type. When will the reversal occur? As you can see, the tip of the triangle ends on March 10-11 (the blue arrow). At that time we could see a move up to the R1- 1 usd. Of course, this means that by the time we do not break the trend wedge lines. Keeping the price within this pattern is the danger that the price will fall slightly (in March) in the 0.25 usd area. This area represents the S3 support of 0.25 usd. If the bull does not return or an extraordinary positive news from Ripple does not appear, this scenario can be fulfilled. Unfortunately, we depend on the Bitcoin movement.
Leaving aside this one-month analysis, let’s move to the likely move for the next week.
Bitcoin shows weakness and we have no TA confirmation, as the bottom point has been reached. On the XRP/USD parity, we will probably climb to 1 usd, after which a new correction will occur. Again, the MACD tool gives us no clue, the signals it provides are ambiguous.
The right buying strategy in this period is step-by-step buying. Share the money in three and buy on three price levels. The first price level will be at S2-0.50 USD, and the last price level will be at S3 – 0.25 USD.


Volatility Shares Launches First-Ever XRP Futures ETF On Nasdaq

XRP Has Officially Dethroned Tether Amid $1.2B Korean Volume

Ripple And XRP Receive Global Recognition As Mentioned In IIF’s BIS Response

Whale Alert: Bithumb Receives 20,000,000 XRP From An Unknown Wallet

XRP Futures Open Interest Registers $1B Rise In The Last Week


Solana Blew Up—These 3 Underrated Altcoins Could Be Next in Line for 10,000% Gains!
After Solana’s incredible ascent, the spotlight is shifting to lesser-known cryptocurrencies that might be ready to soar. Three undervalued altcoins...

Under $1 and Primed to 1000x: The Altcoin Solana and Cardano Whales Are Quietly Buying Ahead of the Summer Surge!
Major investors are secretly acquiring a little-known cryptocurrency priced under a dollar, expecting a major surge this summer. Holders of...

Ethereum to $10K? XRP to $7? This New Altcoin Is Forecasted to Outperform Both!
Some analysts predict that major cryptocurrencies like Ethereum and XRP might soon hit impressive new price points. Yet, whispers in...


$TOKERO LevelUP Token is about to take over the crypto market mindshare!
TOKERO LevelUP Token Set to Transform Crypto Exchange Utility Through Innovative Multi-Ecosystem Integration The driving force behind TOKERO's revolutionary hybrid...

STG Energy Cloud Mining Platform: The Wealth Engine for Bitcoin and Solana Investments in 2025
In 2025, the cryptocurrency market is a whirlwind of volatility and opportunity. Bitcoin has dipped below $80,000 due to rumors...

dw
February 10, 2018 at 4:14 pm
Ripple and XRP will soon distance itself from the other crypto’s as Ripple is a different animal altogether. I believe we are in a healthy restructuring of the the market values and we are also seeing more education of the differences of these coins and their applications! Love your work!