Technical Analysis
Technical Analysis XRP/USD 20/1/2018
I know a lot of people are following my technical analysis. Unfortunately, in the last few weeks, some personal issues have not allowed me to do technical analysis on XRP/USD. We are currently going through a very difficult time. Most of the coins on Crypto Market have had very large declines in recent days. This bear market is still a normal phenomenon. After the enormous increases since the end of 2017, it was normal to follow a downward period. Bitcoin turned out to be a bubble when it reached 20,000 USD.
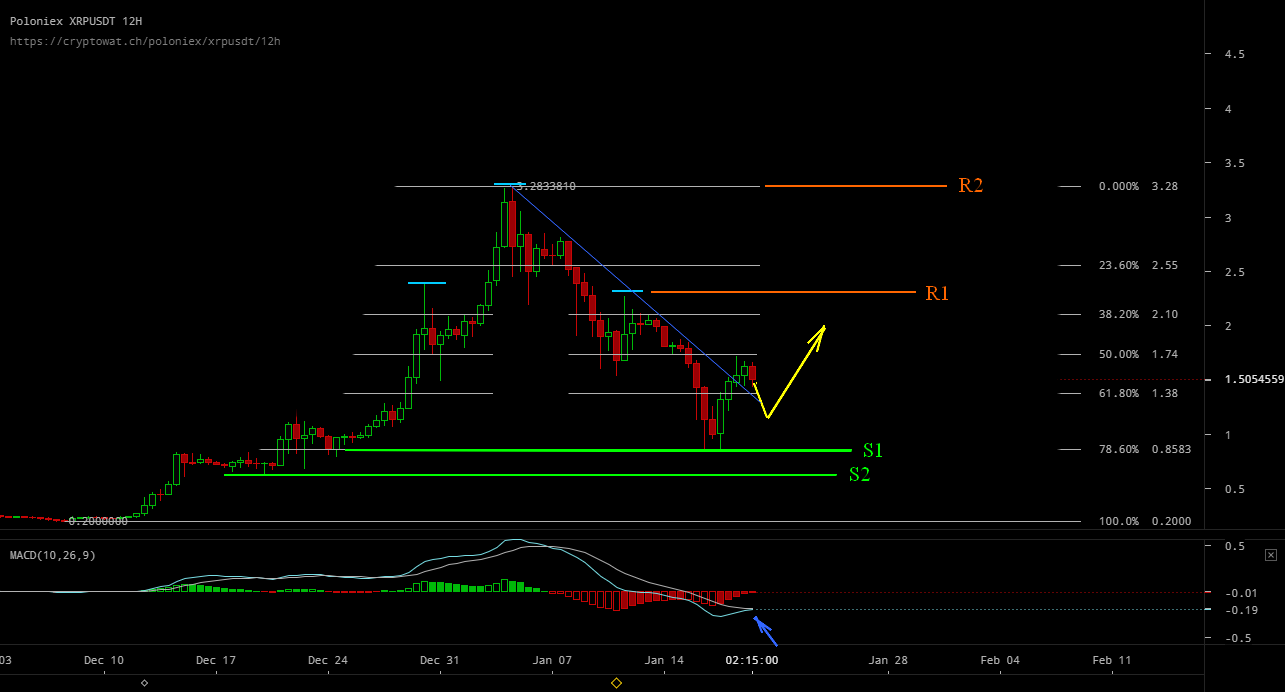
XRP/USD has also had huge increases, so this bearish period is normal. As you can see on the chart, a pattern head and shoulders was formed on the XRP/USD parity.
At the time I perform the technical analysis the XRP/USD price is 1.55 USD. As we can see on the chart the price had a bottom at $0.87 after which we had an aggressive recovery move to the current price. The downward trend line has been broken up, and the price seems to be strengthening at today’s levels. Can we be certain that the minimum point has been reached, and soon will we have a new trend up? At this point, we can not say that. It is possible that after touching the resistance zone R1-2,25 USD we have a new corrective wave. If the corrective wave stops above the previous minimum from S1-$0,87 it means we have a trend reversal pattern.
The resistance lines are: The support lines are:
R1 – 2,25usd S1 – 0,87usd
R2 – 3,2 usd S2 – 0,65usd
What can we expect in this week?
The probable move is upward to $2 or maximum up to $2.25 (R1). After we reach these values, I expect a corrective wave that ends above the previous minimum of S1-$0.87. It is possible that the corrective wave begins before reaching the values specified above. The MACD tool (chart 12 hours) gives us a buy signal.
What is the minimum point where we can fall, if the corrective wave is more aggressive than we expect? If S1-$0.87 is broken down I think $0.65 is the minimum point to which
XRP/USD can fall. The $0.65 area seems an area where the price could have a bottom. The $0.65 area is the area that had a consolidation period in the past.
The MACD tool (chart 12 hours) gives us a buy signal. The probable direction for the next period is drawn in yellow on the chart.


Flareonix Airdrop Is LIVE! Claim Your Share of 100M FXP Today!

Volatility Shares Launches First-Ever XRP Futures ETF On Nasdaq

XRP Has Officially Dethroned Tether Amid $1.2B Korean Volume

Ripple And XRP Receive Global Recognition As Mentioned In IIF’s BIS Response

Whale Alert: Bithumb Receives 20,000,000 XRP From An Unknown Wallet


Solana Blew Up—These 3 Underrated Altcoins Could Be Next in Line for 10,000% Gains!
After Solana’s incredible ascent, the spotlight is shifting to lesser-known cryptocurrencies that might be ready to soar. Three undervalued altcoins...


Under $1 and Primed to 1000x: The Altcoin Solana and Cardano Whales Are Quietly Buying Ahead of the Summer Surge!
Major investors are secretly acquiring a little-known cryptocurrency priced under a dollar, expecting a major surge this summer. Holders of...


Ethereum to $10K? XRP to $7? This New Altcoin Is Forecasted to Outperform Both!
Some analysts predict that major cryptocurrencies like Ethereum and XRP might soon hit impressive new price points. Yet, whispers in...


$TOKERO LevelUP Token is about to take over the crypto market mindshare!
TOKERO LevelUP Token Set to Transform Crypto Exchange Utility Through Innovative Multi-Ecosystem Integration The driving force behind TOKERO's revolutionary hybrid...

STG Energy Cloud Mining Platform: The Wealth Engine for Bitcoin and Solana Investments in 2025
In 2025, the cryptocurrency market is a whirlwind of volatility and opportunity. Bitcoin has dipped below $80,000 due to rumors...
