Technical Analysis
Technical Analysis XRP/USD 22/06/2018
Today we will not make a technical analysis for the next week but a medium-term technical analysis. This technical analyst for the next few months is needed for an overview of the XRP/USD price. Too many people are concentrating on price movement on charts at 15 minutes or one hour. It is good to know that a buy and hold investor should focus on tracking daily charts rather than those for 15 minutes or one hour. The evolution of a 15-minute or one-hour chart is totally insignificant if you intend to hold the XRP coins between 6 months and 2 or 3 years. 15-minute or 1-hour charts are tracked by daily traders.
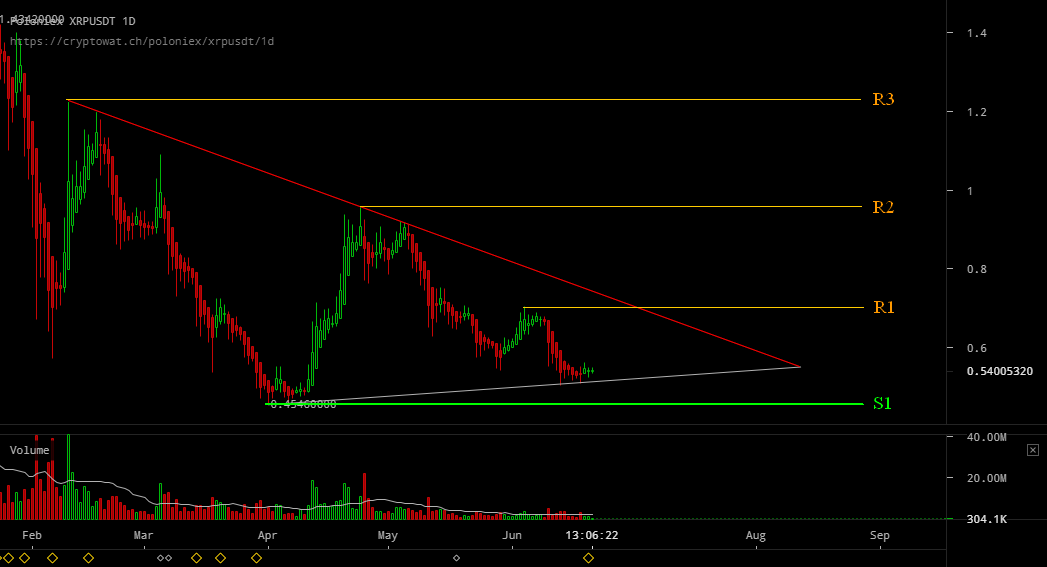
We are in a test period of support areas after the huge declines in the past months. You can see that the force of the sellers has decreased more and more compared to January – February. This can be deduced from the magnitude of the movements downwards. The length of the candle is smaller and the decreases are much slower / per unit of time. This tells us that the strength of the bears has dropped a lot.
We are at the end of the accumulation period and somewhere at the end of July or early August should be a bull movement up to the 1 usd area. I do not expect the 1 usd area to be broken up from the first move. After the price reaches 1 usd, there will be an upward movement of 0.75-0.80 USD. After this corrective move, a new upward movement will start which will break the resistance from 1 usd. The up movement will continue to 1.25 usd, which is the main resistance zone on XRP/USD.
The whole scenario above will take several months. I expect the main strength of 1.25 usd to be reached somewhere in September. Breaking the zone from 1.25 will open the way for the 2 usd price. But this is another TA that will not be written today.
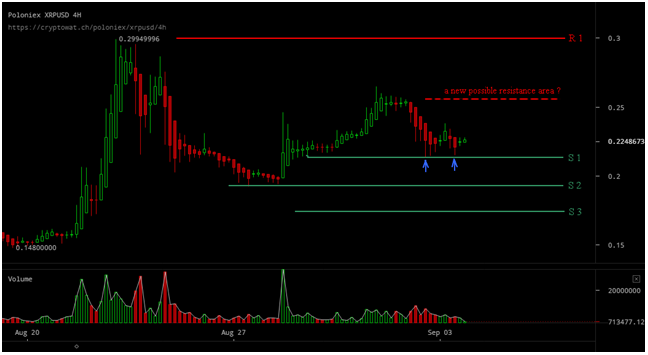
XRP/USD – lines of resistance : XRP/USD – lines of support:
R1 – 0,70 usd S1 – 0,45 usd
R2 – 1,25 usd (psychological) S2 – 0.30 usd
R3 – 1,25 usd (main)
This technical analysis took into account the evolution of the Bitcoin price. Today’s TA is based on the Wyckoff Method, which is one of the oldest and best methods of technical analysis.
For this scenario to take place, we need a few things:
1. Downward trend line (red) to be broken up.
2. Bitcoin does not give us surprises, by releasing news with a strong negative impact.
3. Ripple does not surprise us with news with strong negative impact.
This technical analysis does not take into account the impact of news with a strong positive impact from Ripple. I refer here to the news about the live use of XRapid and XRP by an important player on the cross-border money transfer market.
What’s happening on XRP / USD next week?
Next week I expect the XRP / USD price to start moving up to R1-0.70 USD. In that area, we will have the descending trend line. We’ll see if that area is broken up.


Flareonix Airdrop Is LIVE! Claim Your Share of 100M FXP Today!

Volatility Shares Launches First-Ever XRP Futures ETF On Nasdaq

XRP Has Officially Dethroned Tether Amid $1.2B Korean Volume

Ripple And XRP Receive Global Recognition As Mentioned In IIF’s BIS Response

Whale Alert: Bithumb Receives 20,000,000 XRP From An Unknown Wallet

Solana Blew Up—These 3 Underrated Altcoins Could Be Next in Line for 10,000% Gains!
After Solana’s incredible ascent, the spotlight is shifting to lesser-known cryptocurrencies that might be ready to soar. Three undervalued altcoins...

Under $1 and Primed to 1000x: The Altcoin Solana and Cardano Whales Are Quietly Buying Ahead of the Summer Surge!
Major investors are secretly acquiring a little-known cryptocurrency priced under a dollar, expecting a major surge this summer. Holders of...

Ethereum to $10K? XRP to $7? This New Altcoin Is Forecasted to Outperform Both!
Some analysts predict that major cryptocurrencies like Ethereum and XRP might soon hit impressive new price points. Yet, whispers in...


$TOKERO LevelUP Token is about to take over the crypto market mindshare!
TOKERO LevelUP Token Set to Transform Crypto Exchange Utility Through Innovative Multi-Ecosystem Integration The driving force behind TOKERO's revolutionary hybrid...

STG Energy Cloud Mining Platform: The Wealth Engine for Bitcoin and Solana Investments in 2025
In 2025, the cryptocurrency market is a whirlwind of volatility and opportunity. Bitcoin has dipped below $80,000 due to rumors...
