Technical Analysis
Technical Analysis XRP/USD 08/08/2018

In the last week’s analysis, I said it would be interesting to see if Bitcoin will be able to keep on over the downward trend line. If Bitcoin had managed to keep above the descending trend line, that would have been a positive signal for the entire Crypto Market, including XRP/USD. Unfortunately, the Bitcoin price has not been maintained above the downward trend line and at this point we have not yet emerged from the bear trend.
We have many signs and technical indicators that show us that the bears are tired but at the current pace the exit from this bear trend can last for several months. At this point we need a catalyst element that triggers the bull trend. This catalyst element may appear on Bitcoin or may come from Ripple. If this catalyst element does not come, the slight downward trend may take a few months.
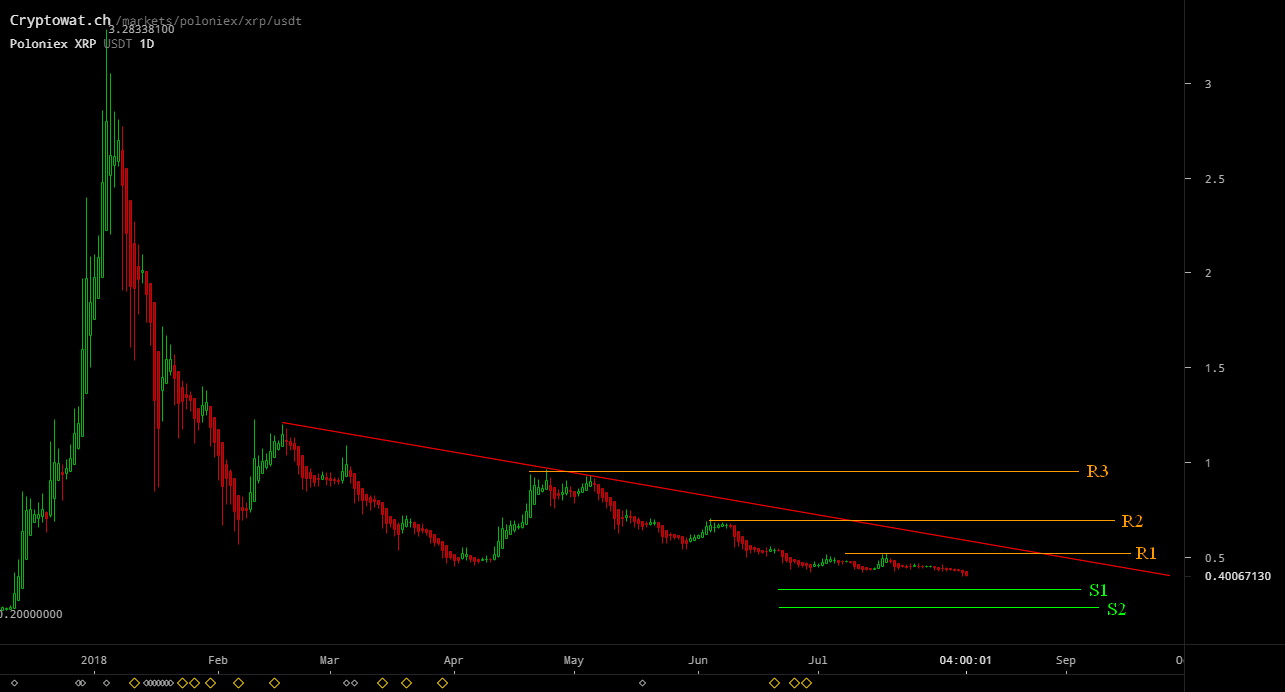
XRP/USD – lines of resistance : XRP/USD – lines of support:
R1 – 0,50 usd S1 – 0,35 usd
R2 – 0,70 usd S2 – 0.30 usd
R3 – 1 usd (psychological)

What’s will happen on XRP/USD next week?
Over the past week, XRP / USD behaved atypically, not biasing the Bitcoin trend and breaking down support line S1 – 0.42 usd. In this situation, the probable direction for the next week is down to S2 support – 0.35 usd. If Bitcoin maintains its downward trend, the S2 support line may be broken and may fall to 0.30 usd.
In 2017 the price of 0.30 USD represented a very strong resistance line. Because of this reason I think 0.30 usd will be a very strong support line. It will not be broken easily, but that does not mean it is impenetrable. If there is panic on the market and this area can be broken. Do not forget these drops are the last tired bear’s movements. In the near future this trend will change. A bear trend can not last forever.


