Technical Analysis
XRP Technical Analysis: Price moving within a symmetrical triangle

Long-Term Outlook
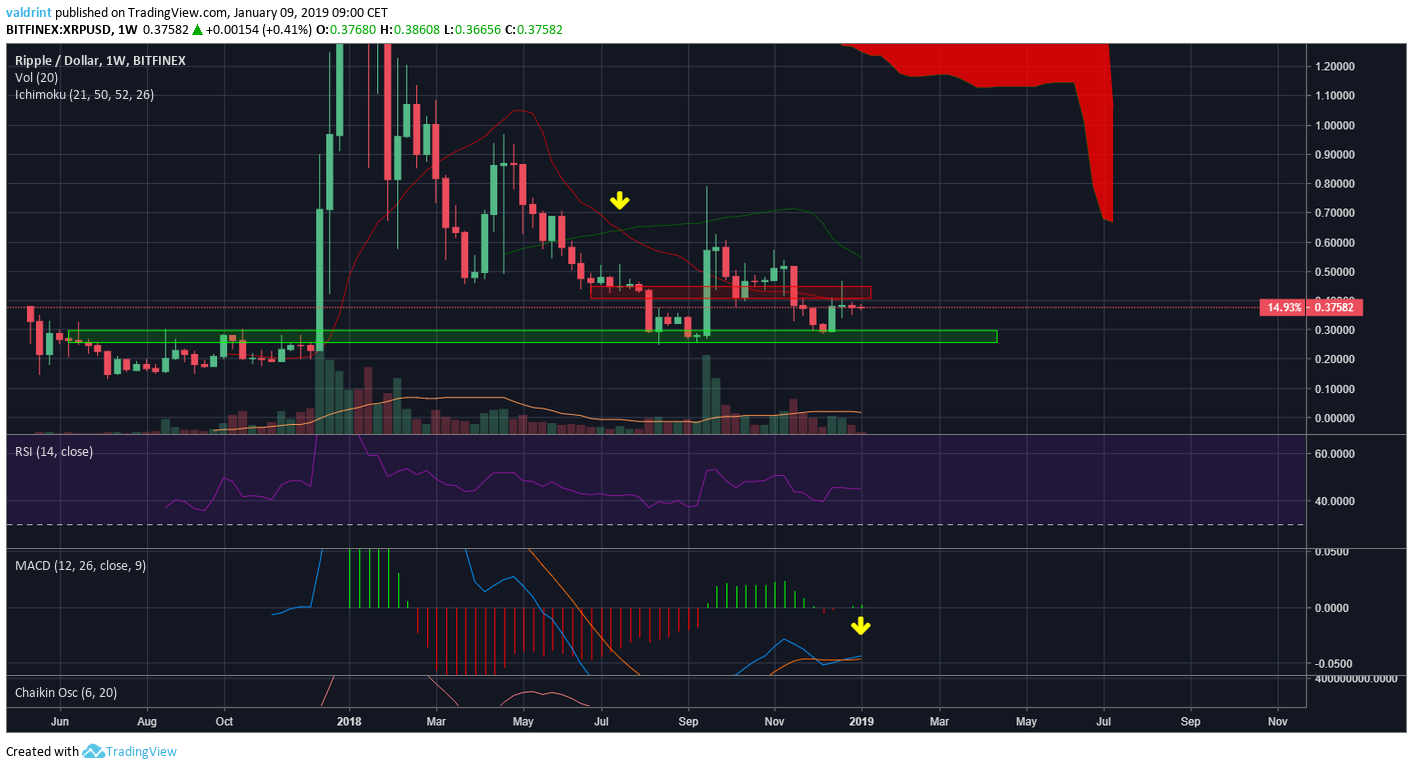
A look at the Weekly chart for XRP shows that price hit support at $0.3 (formed by the highs of August until October 2017 and subsequently lows of August until September 2018) and quickly reversed in the area near to $0.4. Price made a spinning top candle which indicates indecision in the market and is currently trading at $0.37. Price is facing resistance from the 7-period moving average, which has previously made a bearish cross (yellow arrow). The RSI is at 45, indicating neither overbought nor oversold conditions. While the MACD has made a bullish cross (bottom yellow arrow) it is going up with a minimal amount of strength.
Medium-Term Outlook
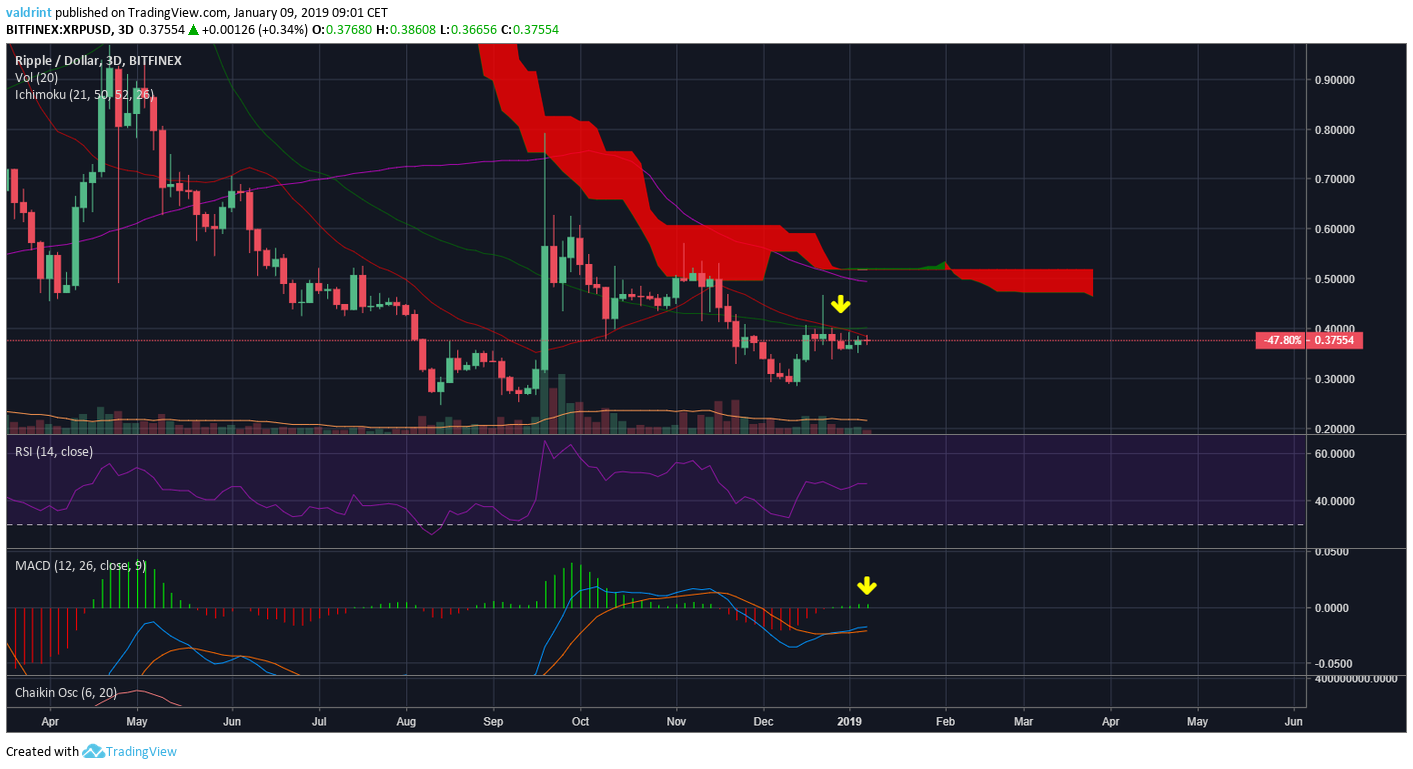
A look at the 3-day chart shows similar indecision. The RSI is at 45, indicating neither overbought nor oversold conditions. The MACD has made a bullish cross and is going up with minimal strength. However, the 7 and 21 period moving averages have made a bearish cross, and are providing resistance to price. Furthermore, price is facing resistance from the 50-period MA and the Ichimoku cloud.
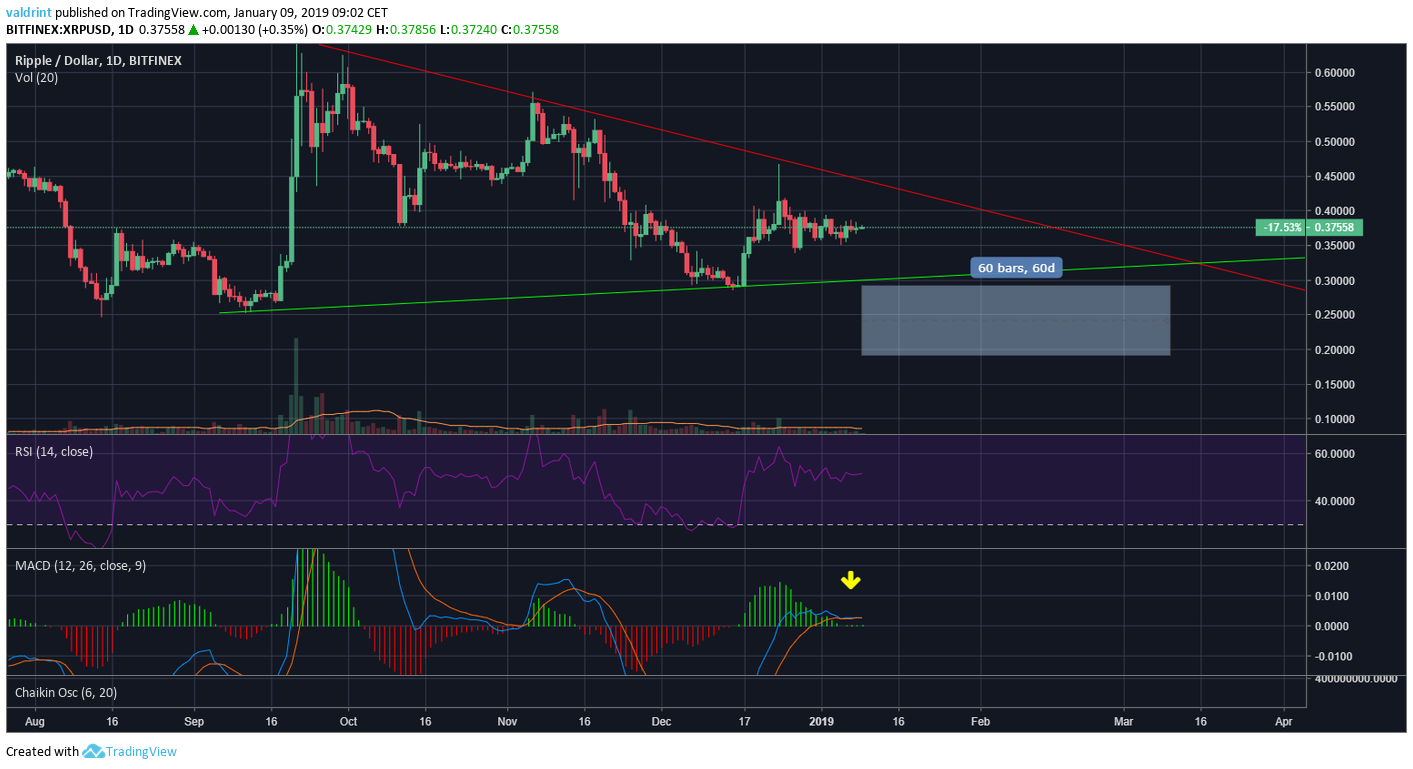
A look at the Daily chart for Ripple finally gives us a structure in which price is currently moving in. Price is moving within the confines of a symmetrical triangle with resistance at the area near $0.42 (red line) and support at $0.3 (green line). The MACD is stuck between making and rejecting a bearish cross and it has had minimal strength for the past 7 days. It is certainly a possibility that price only moves within the confines of the triangle for the next 60 days.
Short-Term Outlook
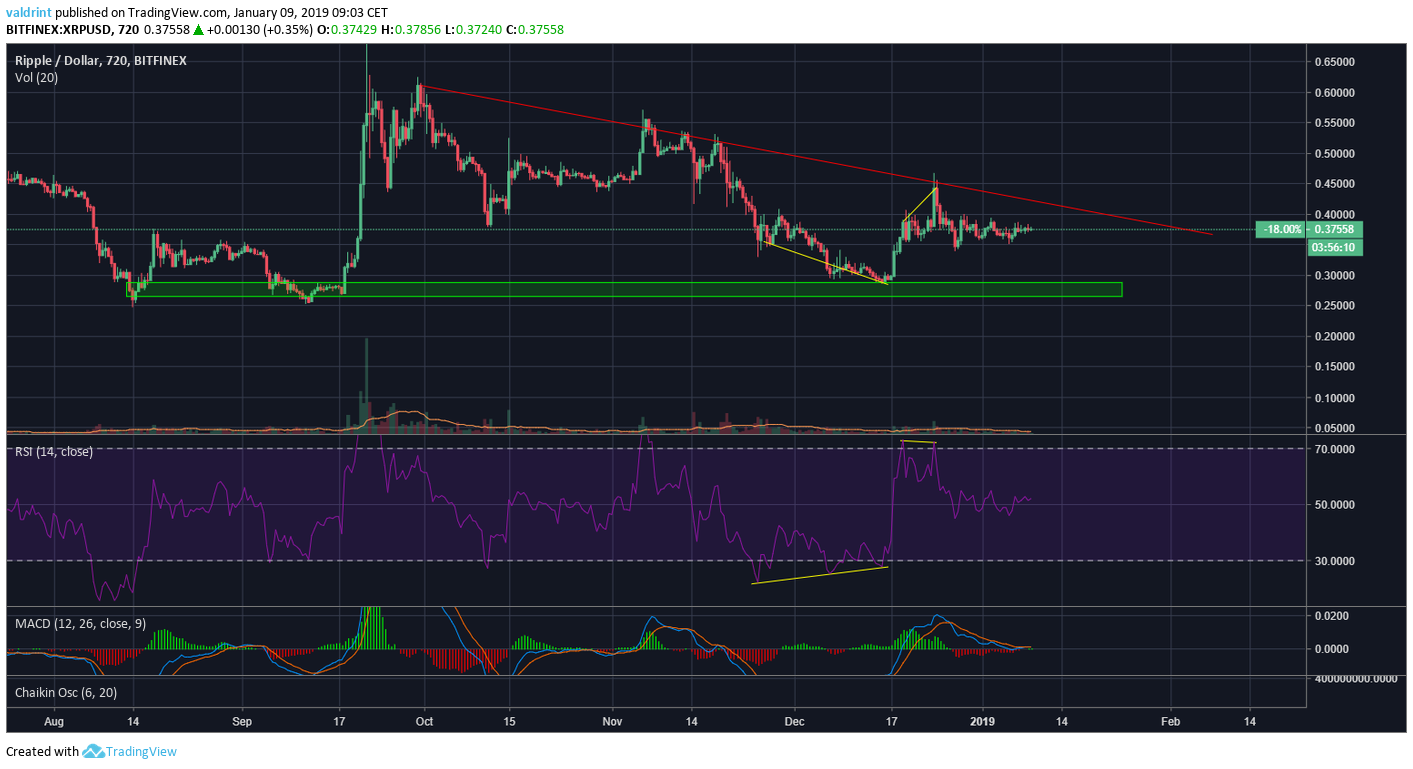
A look at the 12-hour chart gives us more information about price movements. As we can see, the move upward from $0.3 to $0.4 was preceded by significant bullish divergence in the RSI. Furthermore, there was bearish divergence once price touched the resistance line (red line) and promptly reversed.
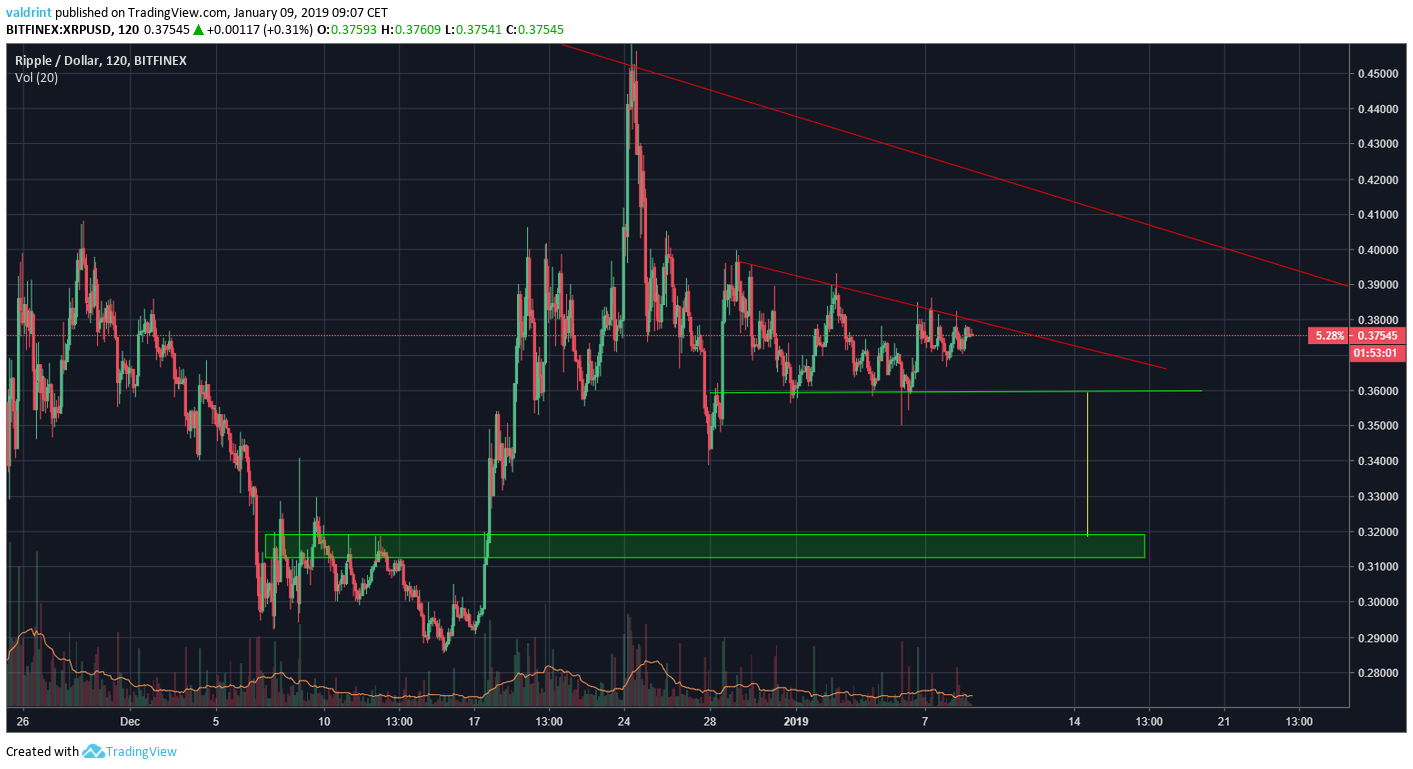
Finally, a look at the 2-hour chart provides another trading structure. Price is seemingly moving in a descending triangle (bearish pattern) for the past week. A breakdown of the triangle would put the mini-support area at $0.32 formed by the highs of December 7-17 in play. The yellow solid line is the height of triangle projected from the breakdown point.
Conclusions
- In a Daily timeframe price is moving within a symmetrical triangle
- Indicators show indecision in the market
- In the short-term price is moving in a descending triangle


