Technical Analysis
Ripple Price Technical Analysis XRP/USD 18/11/2018
We witnessed the past few days with a less positive fact that also affected the XRP price. Bitcoin price had a fall and the support area of 6000 was broken. In the technical analysis of October 31, 2018 I was saying that I expect Bitcoin to move up to 7500 usd. Typically, such a graphic formation ends up moving upwards, but this is not the case.
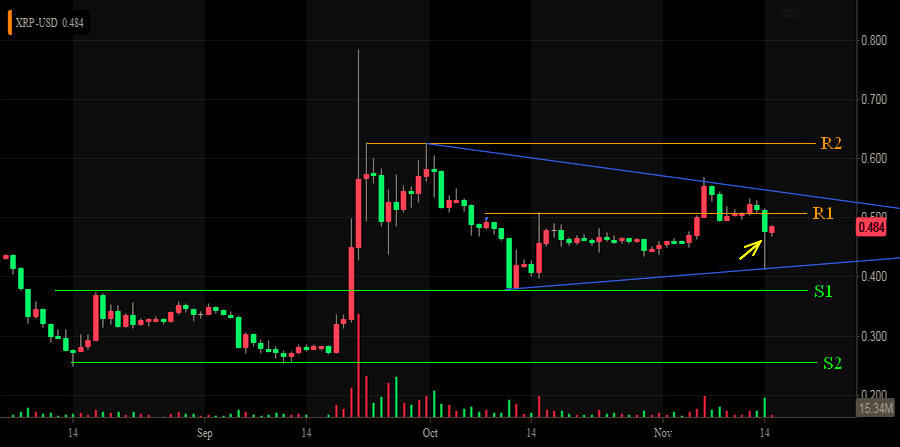
Breaking support from 6000 usd keeps Bitcoin in a bear market. In the lower part we have a first support at 5000 usd. Unfortunately, this is just a psychological support offered by the 5000 round. Under this area, there is no technical support other than 2900 usd. If the psychological support of 5000 usd is broken, the Bitcoin fall will be deep. XRP / USD was affected by Bitcoin and had a fall of up to 0.42 USD. Subsequently, XRP / USD recovered, climbing towards resistance R1 – 0.50 usd.
I would point out that the XRP / BTC and XRP / ETH pairs have recovered all the losses and are currently at higher prices than before the fall. This means that many of those who had in the BTC and ETH portfolios bought XRP. A reorganization of portfolios has taken place these days. Probably many owners of BTC and ETH have finally realized that XRP will have the greatest potential for profit in the future.
The resistance lines: The support lines:
R1 – 0,50 usd S1 – 0,36 usd
R2 – 0,60 usd S2 – 0,25 usd (bottom)
R3 – 1 usd (psychological)
What’s happening on XRP / USD next week?
Considering the above, it is appropriate to reassess the TA position. For the first time I take into account the hypothesis of lowering Bitcoin under 4850 – 5000 usd. I did not say that will happen, but we must also take into account this possible scenario.
Bitcoin is still very weak and if next week it will not rise above 6000 usd and will keep above this price it is very likely it will drop to 5000 usd. I have always considered 4850-5000 usd a bottom area on Bitcoin. I mentioned this in some technical analyzes this summer. We will see if buyers will be interested in Bitcoin at the price of 5000 usd to make this area a bottom point.
If Bitcoin falls to 5000 usd, XRP / USD will fall, testing support S1- 0.35 USD. As you can see on the diagram (drawn in blue) a symmetrical triangle was formed. Nothing is clear when we have a symmetrical triangle on the chart.
It should be noted that on the chart, (yellow arrow) it can be seen that the 16 November candles are actually an inverted Doji Star. This candles indicate that buyers were aggressive and could follow a move upwards. We’ll see if this really happens. As you can see, the indications provided by the technical analysis are mixed, and it is impossible to predict a likely direction.
I’m very curious what will happen to the price of the XRP / BTC and XRP / ETH pairs, with a very good evolution over the last few days.


Ripple (XRP), ETFSwap (ETFS), And Ondo Finance (ONDO) Are Leading The Crypto ETF Economy

Ripple CEO Says XRP ETF Is Coming – Here’s How To Position For This Bullish Event

Bitcoin’s Value Climbs Above $71,000 Ahead of Impending Halving Event

Best Bitcoin Miners in 2024

BlockDAG’s Visionary Leap: Sparking a Crypto Revolution with 5000% ROI Potential
Ripple (XRP), ETFSwap (ETFS), And Ondo Finance (ONDO) Are Leading The Crypto ETF Economy
ETFSwap (ETFS), along with Ripple (XRP) and Ondo Finance (ONDO), is spearheading the dynamic crypto ETF economy, paving the way...
Ripple CEO Says XRP ETF Is Coming – Here’s How To Position For This Bullish Event
Ripple CEO, Brad Garlinghouse, has suggested the possibility of an XRP ETF being approved by governmental authorities soon. He made...

BlockDAG’s Visionary Leap: Sparking a Crypto Revolution with 5000% ROI Potential
BlockDAG’s groundbreaking announcement has stirred a wave of excitement in the cryptocurrency community, following its keynote presentation broadcasted across the...


Earn Passive Income Quickly with ARKMining Cloud Mining – Daily Profits
ARKMining, a leading cloud mining platform, recently released a complete analysis report demonstrating its potential to help individuals easily earn...

Top Crypto Altcoins of 2024: SHIB, MK, and BDAG – Unlock Your Path to Growth and Profit
The best crypto altcoins of 2024, according to top crypto analysts are Shiba Inu (SHIB), Meme Kombat (MK), and BlockDAG...
