Technical Analysis
Ripple Technical Analysis XRP/USD 05/04/2018
In the last technical analysis, I was saying that I expect a corrective move that will begin after R1 -1 USD or R2-1.25 USD will be reached. Here’s how the Bitcoin and XRP / USD move is a small one. On the XRP / USD chart at 4 hours, a symmetrical triangle is formed. As you know from previous technical analyzes, the symmetrical triangle is not a pattern that provides a clear direction of the price. In conclusion, we have equal chances for a up or down movement.
The resistance lines are: The support lines are:
R1 – 1 USD (psychological) S1 – 0,70 USD
R2 – 1,25 USD S2 – 0,45 USD
R3 – 1,4 USD
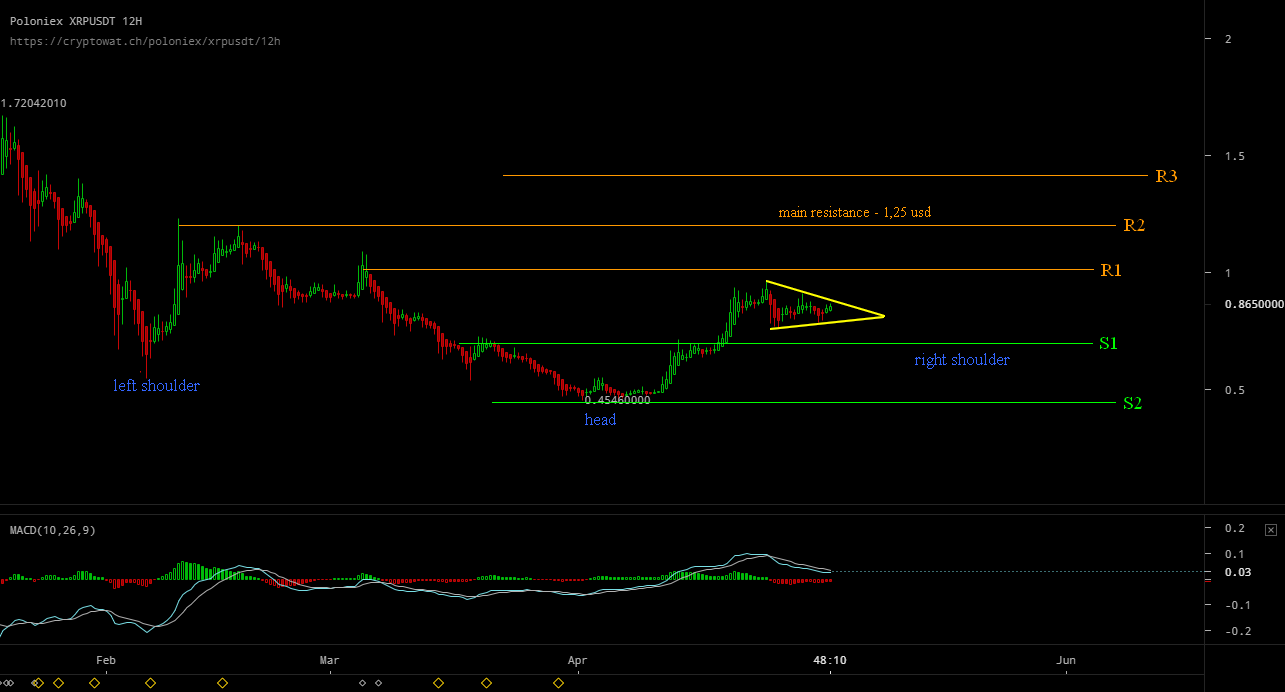
For the next week, we have two possible scenarios:
A downward move, with possible stopping point at S1 – 0.70 USD. On the daily chart, an inverted pattern head and shoulders are formed, or a cup and handle pattern. For the reversed head and shoulders pattern, the right shoulder has not yet been formed. Also, if the pattern is one cup and handle, the handle is not yet formed. Lowering to S1 – 0.70 USD and subsequent climb, requires the exact formation of those patterns. I mention that both the inverted head and shoulders pattern and the cup and handle pattern are a bull pattern.
We also have a second scenario: the longer we will stay in a lateral move without having a significant correction on Bitcoin and XRP / USD, as the conditions for impulsive movement up to 12000 usd are created on Bitcoin and 1.25 USD on XRP / USD. It remains to see what is happening next week. We will have a correction of up to 0.70 USD after which we will climb to 1.25 USD or we will climb directly to 1.25 USD and then we will have the correction down to 0.70 USD.
At this point, the MACD tool shows a sell-off period, but is above the neutral line, indicating the keeping of a relative bull’s strength.


Volatility Shares Launches First-Ever XRP Futures ETF On Nasdaq

XRP Has Officially Dethroned Tether Amid $1.2B Korean Volume

Ripple And XRP Receive Global Recognition As Mentioned In IIF’s BIS Response

Whale Alert: Bithumb Receives 20,000,000 XRP From An Unknown Wallet

XRP Futures Open Interest Registers $1B Rise In The Last Week


Solana Blew Up—These 3 Underrated Altcoins Could Be Next in Line for 10,000% Gains!
After Solana’s incredible ascent, the spotlight is shifting to lesser-known cryptocurrencies that might be ready to soar. Three undervalued altcoins...

Under $1 and Primed to 1000x: The Altcoin Solana and Cardano Whales Are Quietly Buying Ahead of the Summer Surge!
Major investors are secretly acquiring a little-known cryptocurrency priced under a dollar, expecting a major surge this summer. Holders of...


Ethereum to $10K? XRP to $7? This New Altcoin Is Forecasted to Outperform Both!
Some analysts predict that major cryptocurrencies like Ethereum and XRP might soon hit impressive new price points. Yet, whispers in...


$TOKERO LevelUP Token is about to take over the crypto market mindshare!
TOKERO LevelUP Token Set to Transform Crypto Exchange Utility Through Innovative Multi-Ecosystem Integration The driving force behind TOKERO's revolutionary hybrid...

STG Energy Cloud Mining Platform: The Wealth Engine for Bitcoin and Solana Investments in 2025
In 2025, the cryptocurrency market is a whirlwind of volatility and opportunity. Bitcoin has dipped below $80,000 due to rumors...
