Technical Analysis
Ripple Technical Analysis XRP/USD 27/05/2018

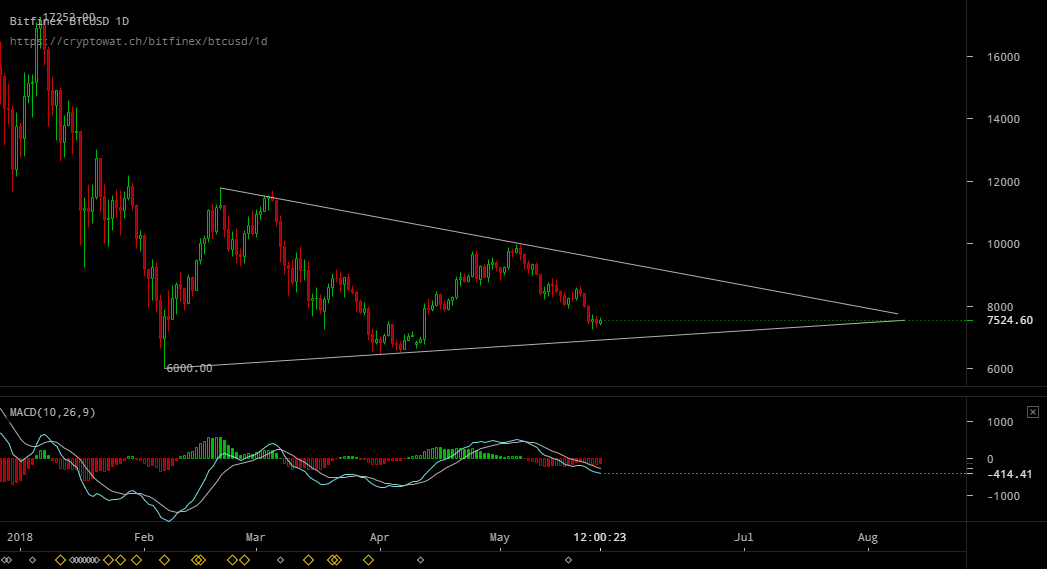
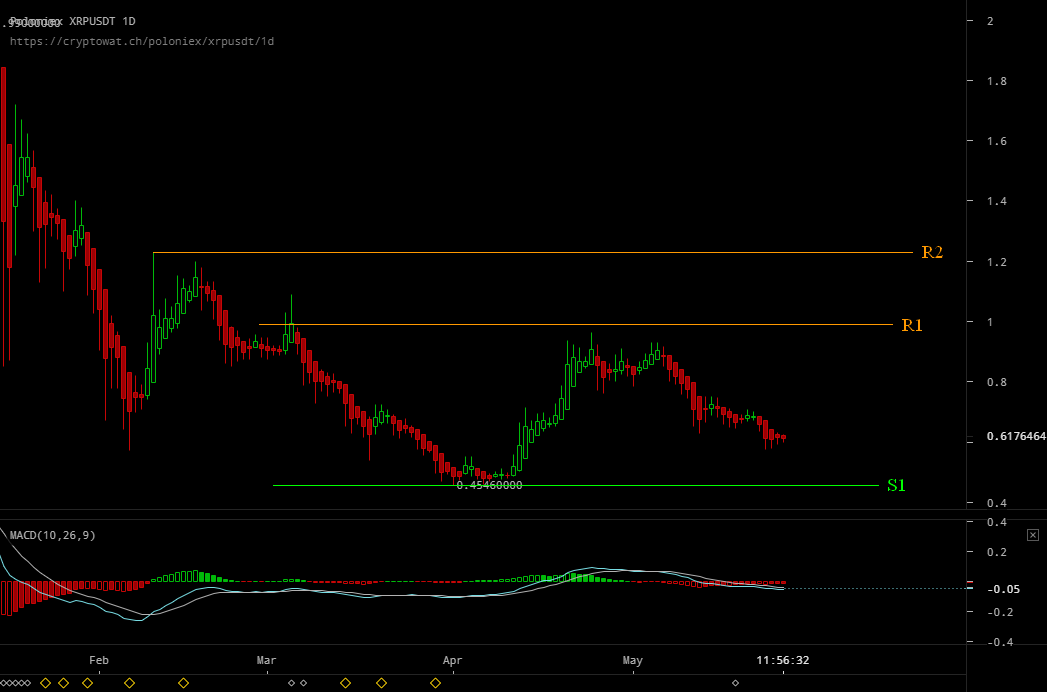
Here’s how the price has moved in slow-motion in the last week. As anticipated in the latest technical analysis, the price did not break down the $7000 area on Bitcoin and $0.55 on XRP. From these levels we anticipate an upward movement. This move has not yet begun, but I’m confident that next week we will start an upward move to $10000 on Bitcoin and $1 on XRP. You can see below on the Bitcoin chart that this downward movement of up to $7200 is actually a new upward trend line test.

This upward trend line represents a very important support on Bitcoin. We can see that on the Bitcoin chart a symmetrical triangle pattern was formed. Generally this pattern is neutral. He can not tell us a clear direction. The tip of the triangle can end with a downward movement, or a move up. This time I think the triangle will end with a move up.
The reason for a upward movement is precisely the ascending support line at the bottom of the triangle pattern. It is quite unlikely that this support line is broken down. Also, considering that prices are cheap, a price increase is more likely than a decrease.
XRP/USD – lines of resistance : XRP/USD – lines of support:
R1 – 1 USD (psychological) S1 – 0,45 USD
R2 – 1,25 USD S2 – 0.30 USD
R3 – 1,4 USD

What’s happening on XRP / USD next week?
So for the next week I think we will have a brief consolidation period in the range 7000-7500 usd after which we will start a moving move. XRP/USD will have a consolidation move in the 0.55-0.64 USD range, after which an upward movement will begin.


