Technical Analysis
Ripple Price Technical Analysis XRP/USD 03/03/2018

Now, when I write the technical analysis, Bitcoin broke up, downward trend line. This is the most positive thing in the last period. TA says I got out of the downward trend. However, we need to see if the next corrective wave will confirm that it supports the descending trend line. If the trend line will be confirmed as a support (will not be broken down), does Bitcoin move quickly to the maximum of $20000? Not! Up there, we could have a rather complex movement with waves up, followed by corrective waves.
What should we remember? Well, this break up of the descending trend line was awaited by traders using the most secure buying strategies. There are traders who prefer to adopt later, but safer buying positions. The feeling on the market has changed a few weeks ago. Surely, the current feeling on the market is no longer pessimism.
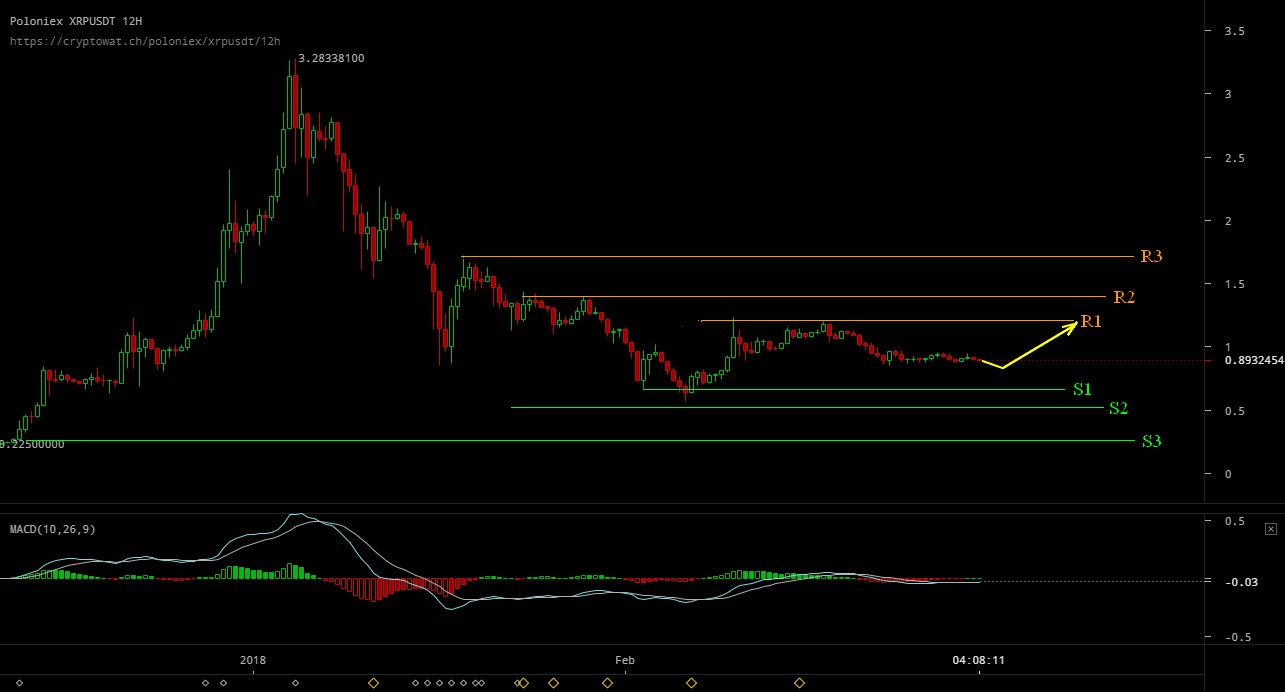
The resistance lines are: The support lines are:
R1 – $1,25 S1 – $0,65
R2 – $1,4 S2 – $0,50 (psychological)
R3 – $1,72 S3 – $0,25
What can we expect in the next week?
Despite the very good news a few days ago, the XRP/USD price is traded in a very narrow range of prices. We actually have a lateral move, and our target price (R1 -1.25 USD) was not reached. We have a classic consolidation movement. This movement is perfectly normal, following the downward trend of recent times. Next week, we will have the same lateral move, with small volumes traded. What could the price of XRP/USD move upwards? The appearance of whales on the market, or a really important news. For example, live use of XRP by MoneyGram. The probable move for the next period is drawn in yellow.
In closing the technical analysis, we’ll take a look at the general market capitalization chart on Crypto Market. More specifically, for who does not know: a chart of the money coming in, or going out of the Crypto Market.
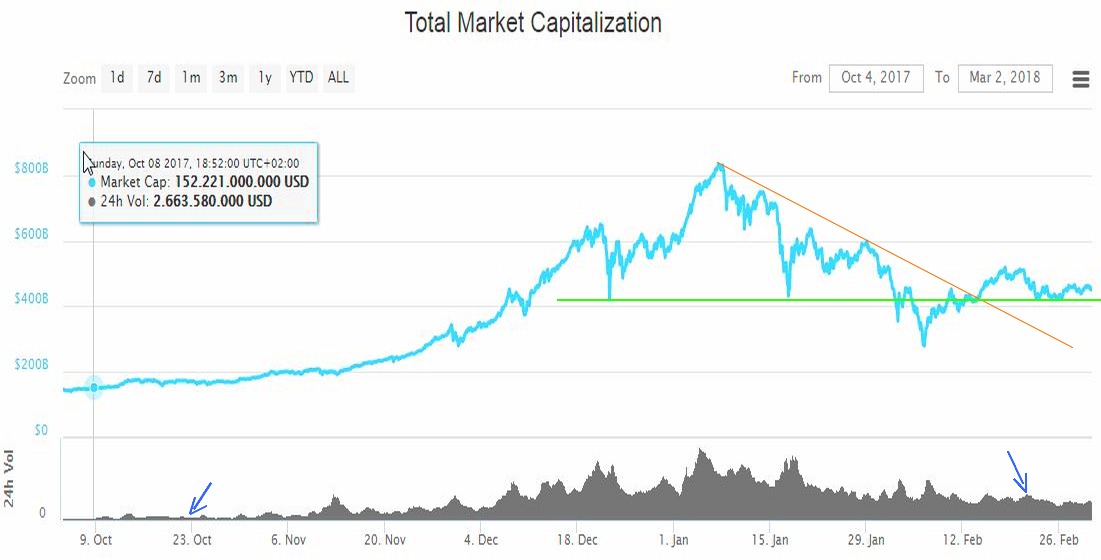
On this chart, we can see that the trend line (red) was broken. We are at the former support line (green) now. Keeping this area is a positive thing. We can also note that the money entering the Crypto Market is kept at quite high levels. Money launches on Crypto Market are kept above levels in October 2017. Basically, this means that after the drastic fall in the last period, large amounts of money have begun to enter the Crypto Market again.
In conclusion: Crypto Market has not been abandoned by large investors. They are present. The two blue arrows are placed on the chart to make a comparison.


Flareonix Airdrop Is LIVE! Claim Your Share of 100M FXP Today!

Volatility Shares Launches First-Ever XRP Futures ETF On Nasdaq

XRP Has Officially Dethroned Tether Amid $1.2B Korean Volume

Ripple And XRP Receive Global Recognition As Mentioned In IIF’s BIS Response

Whale Alert: Bithumb Receives 20,000,000 XRP From An Unknown Wallet


Solana Blew Up—These 3 Underrated Altcoins Could Be Next in Line for 10,000% Gains!
After Solana’s incredible ascent, the spotlight is shifting to lesser-known cryptocurrencies that might be ready to soar. Three undervalued altcoins...


Under $1 and Primed to 1000x: The Altcoin Solana and Cardano Whales Are Quietly Buying Ahead of the Summer Surge!
Major investors are secretly acquiring a little-known cryptocurrency priced under a dollar, expecting a major surge this summer. Holders of...


Ethereum to $10K? XRP to $7? This New Altcoin Is Forecasted to Outperform Both!
Some analysts predict that major cryptocurrencies like Ethereum and XRP might soon hit impressive new price points. Yet, whispers in...


$TOKERO LevelUP Token is about to take over the crypto market mindshare!
TOKERO LevelUP Token Set to Transform Crypto Exchange Utility Through Innovative Multi-Ecosystem Integration The driving force behind TOKERO's revolutionary hybrid...

STG Energy Cloud Mining Platform: The Wealth Engine for Bitcoin and Solana Investments in 2025
In 2025, the cryptocurrency market is a whirlwind of volatility and opportunity. Bitcoin has dipped below $80,000 due to rumors...
