Technical Analysis
Technical Analysis XRP/USD 25/04/2018

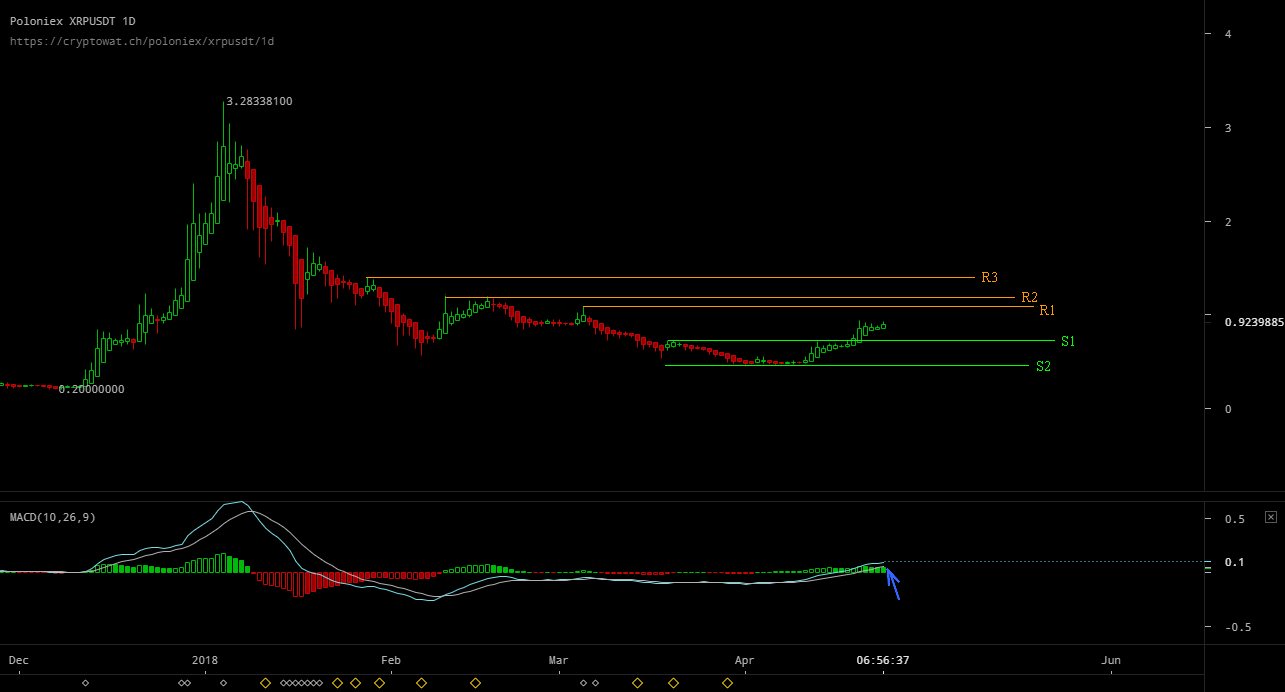
The XRP/USD movement in the last two weeks has been a positive one. More than that, it was the recovery move everyone was expecting. This upward movement was a costly and sustained bull movement. It’s what I expect to see on the chart after that constant downward movement of the bears. XRP/USD has had a great move in these two weeks. I have often noticed that XRP grew up before Bitcoin. This time, there were moments when the upward movement of XRP was followed by Bitcoin. XRP also increased more than Bitcoin.
For the next week, I expect Bitcoin to climb to the psychological level of 10.000 USD. It remains to see if Bitcoin will be able to pass over 10.000 USD and will climb to the main resistance of 12.000 USD. Regardless of this, we need to be aware that a corrective move will take place soon. I’m not sure if she will start at 10.000 or 12.000 USD on Bitcoin. At this point, I’m pretty sure the bottom has been reached. The Bitcoin price broke the descending trendline, but this has not yet been confirmed as the support area. I expected that the correction that will come is a reasonable one and the pattern appearing on the chart will be a reversed head and shoulders. Right now, the right shoulder has not yet been formed.
The resistance lines are: The support lines are:
R1 – 1 usd (psychological) S1 – 0,70 USD
R2 – 1,25 USD S2 – 0,45 USD
R3 – 1,4 USD
What can we expect in the next week?
In conclusion, XRP/USD will begin a corrective move from R1 -1 USD or R2 -1.25 USD. For that pattern to be valid, the XRP/USD correction should not fall below S1 -0,70 USD. Any correction that goes below these values will be a proof of bulls weakness.
For two months the MACD has given us ambiguous signals, but now it has crossed the neutral line, which means we are in a positive territory (a trend up).
I’ll add a few words about Cryptocurrency Market Capitalizations. It has grown in the last two weeks from $244 billion to $430 billion. As you see the fiat sums that have entered Crypto Market, the last two weeks are quite high. This represents an increase of 80%. However, the value of $500 billion is an important area, which must be exceeded so that the Crypto Market can reach ATH of $820 billion.
Image Source: Finder.com.au


Ripple (XRP), ETFSwap (ETFS), And Ondo Finance (ONDO) Are Leading The Crypto ETF Economy

Ripple CEO Says XRP ETF Is Coming – Here’s How To Position For This Bullish Event

Bitcoin’s Value Climbs Above $71,000 Ahead of Impending Halving Event

Best Bitcoin Miners in 2024

BlockDAG’s Visionary Leap: Sparking a Crypto Revolution with 5000% ROI Potential
Ripple (XRP), ETFSwap (ETFS), And Ondo Finance (ONDO) Are Leading The Crypto ETF Economy
ETFSwap (ETFS), along with Ripple (XRP) and Ondo Finance (ONDO), is spearheading the dynamic crypto ETF economy, paving the way...
Ripple CEO Says XRP ETF Is Coming – Here’s How To Position For This Bullish Event
Ripple CEO, Brad Garlinghouse, has suggested the possibility of an XRP ETF being approved by governmental authorities soon. He made...

BlockDAG’s Visionary Leap: Sparking a Crypto Revolution with 5000% ROI Potential
BlockDAG’s groundbreaking announcement has stirred a wave of excitement in the cryptocurrency community, following its keynote presentation broadcasted across the...


Earn Passive Income Quickly with ARKMining Cloud Mining – Daily Profits
ARKMining, a leading cloud mining platform, recently released a complete analysis report demonstrating its potential to help individuals easily earn...


Top Crypto Altcoins of 2024: SHIB, MK, and BDAG – Unlock Your Path to Growth and Profit
The best crypto altcoins of 2024, according to top crypto analysts are Shiba Inu (SHIB), Meme Kombat (MK), and BlockDAG...
