Technical Analysis
XRP price breaks crucial resistance once again
- XRP/USD price gains 1% over in 24 hours
- The resistance level at $0.26500 is tested
- 1 hour MACD indicator is bullish
1 Day XRP/USD price chart
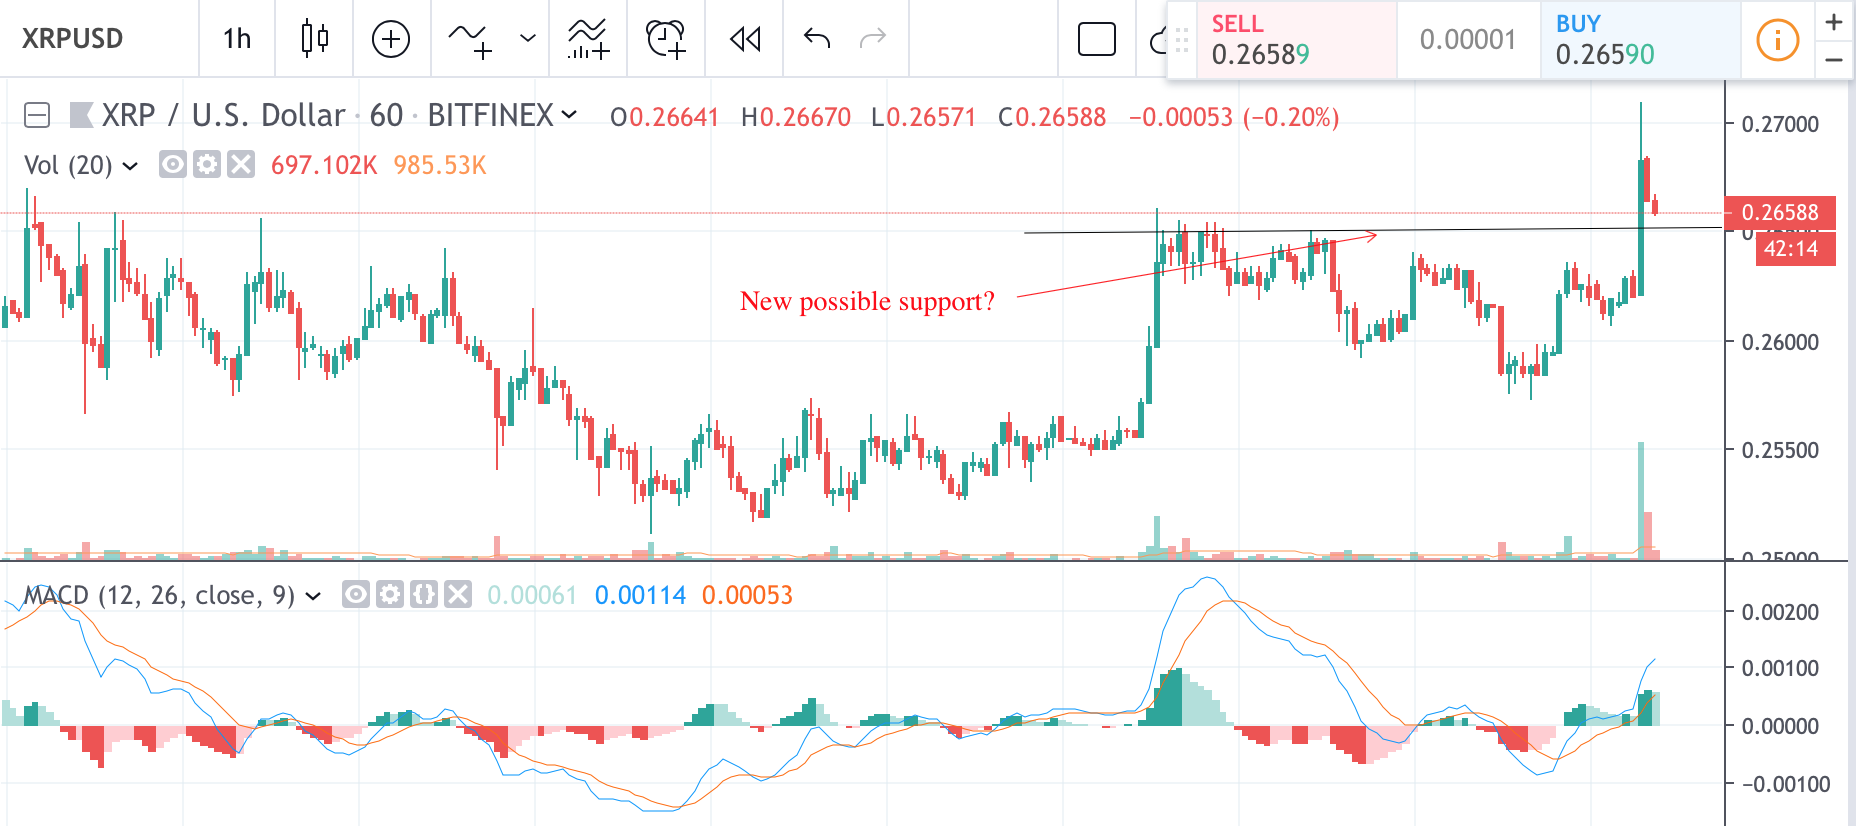
After trading horizontally since the weekend XRP price yet again went above the resistance level of $0.26500. Can that resistance become new support is yet to be seen. High-tail candlestick that finished the bullish momentum move does indeed look bearish and may suggest that price will simply retrace back into consolidation zone between $0.25800 and $0.26500. MACD indicator on one-hour price chart is suggesting though that bulls may still push the price higher in an attempt to finally move away from the $0.26500 in the upward direction.
XRP price really needs to consolidate at the current level and then move upwards for the market to move into bullish territory. Fall in demand would definitely increase the chances of downtrend down to levels $0.25500 in the short term.
Chart source: Tradingview
Disclaimer: Markets, instruments, and advice on this page are for informational purposes only and should not in any way come across as a recommendation to buy or sell in these assets. You should do your own thorough research before making any investment decisions. Ripplecoinnews does not in any way guarantee that this information is free from mistakes, errors, or material misstatements. Investing in Cryptocurrencies involves a great deal of risk, including the loss of all or a portion of your investment, as well as emotional distress. All risks, losses, and costs associated with investing, including total loss of principal, are your responsibility.


Volatility Shares Launches First-Ever XRP Futures ETF On Nasdaq

XRP Has Officially Dethroned Tether Amid $1.2B Korean Volume

Ripple And XRP Receive Global Recognition As Mentioned In IIF’s BIS Response

Whale Alert: Bithumb Receives 20,000,000 XRP From An Unknown Wallet

XRP Futures Open Interest Registers $1B Rise In The Last Week


Solana Blew Up—These 3 Underrated Altcoins Could Be Next in Line for 10,000% Gains!
After Solana’s incredible ascent, the spotlight is shifting to lesser-known cryptocurrencies that might be ready to soar. Three undervalued altcoins...

Under $1 and Primed to 1000x: The Altcoin Solana and Cardano Whales Are Quietly Buying Ahead of the Summer Surge!
Major investors are secretly acquiring a little-known cryptocurrency priced under a dollar, expecting a major surge this summer. Holders of...

Ethereum to $10K? XRP to $7? This New Altcoin Is Forecasted to Outperform Both!
Some analysts predict that major cryptocurrencies like Ethereum and XRP might soon hit impressive new price points. Yet, whispers in...


$TOKERO LevelUP Token is about to take over the crypto market mindshare!
TOKERO LevelUP Token Set to Transform Crypto Exchange Utility Through Innovative Multi-Ecosystem Integration The driving force behind TOKERO's revolutionary hybrid...

STG Energy Cloud Mining Platform: The Wealth Engine for Bitcoin and Solana Investments in 2025
In 2025, the cryptocurrency market is a whirlwind of volatility and opportunity. Bitcoin has dipped below $80,000 due to rumors...
