Technical Analysis
XRP/USD price is in narrowing trading channel
- XRP price is down by 0.8%
- Narrowing trading channel formes
- The support is $0.23600.
1 Hour XRP/USD price chart
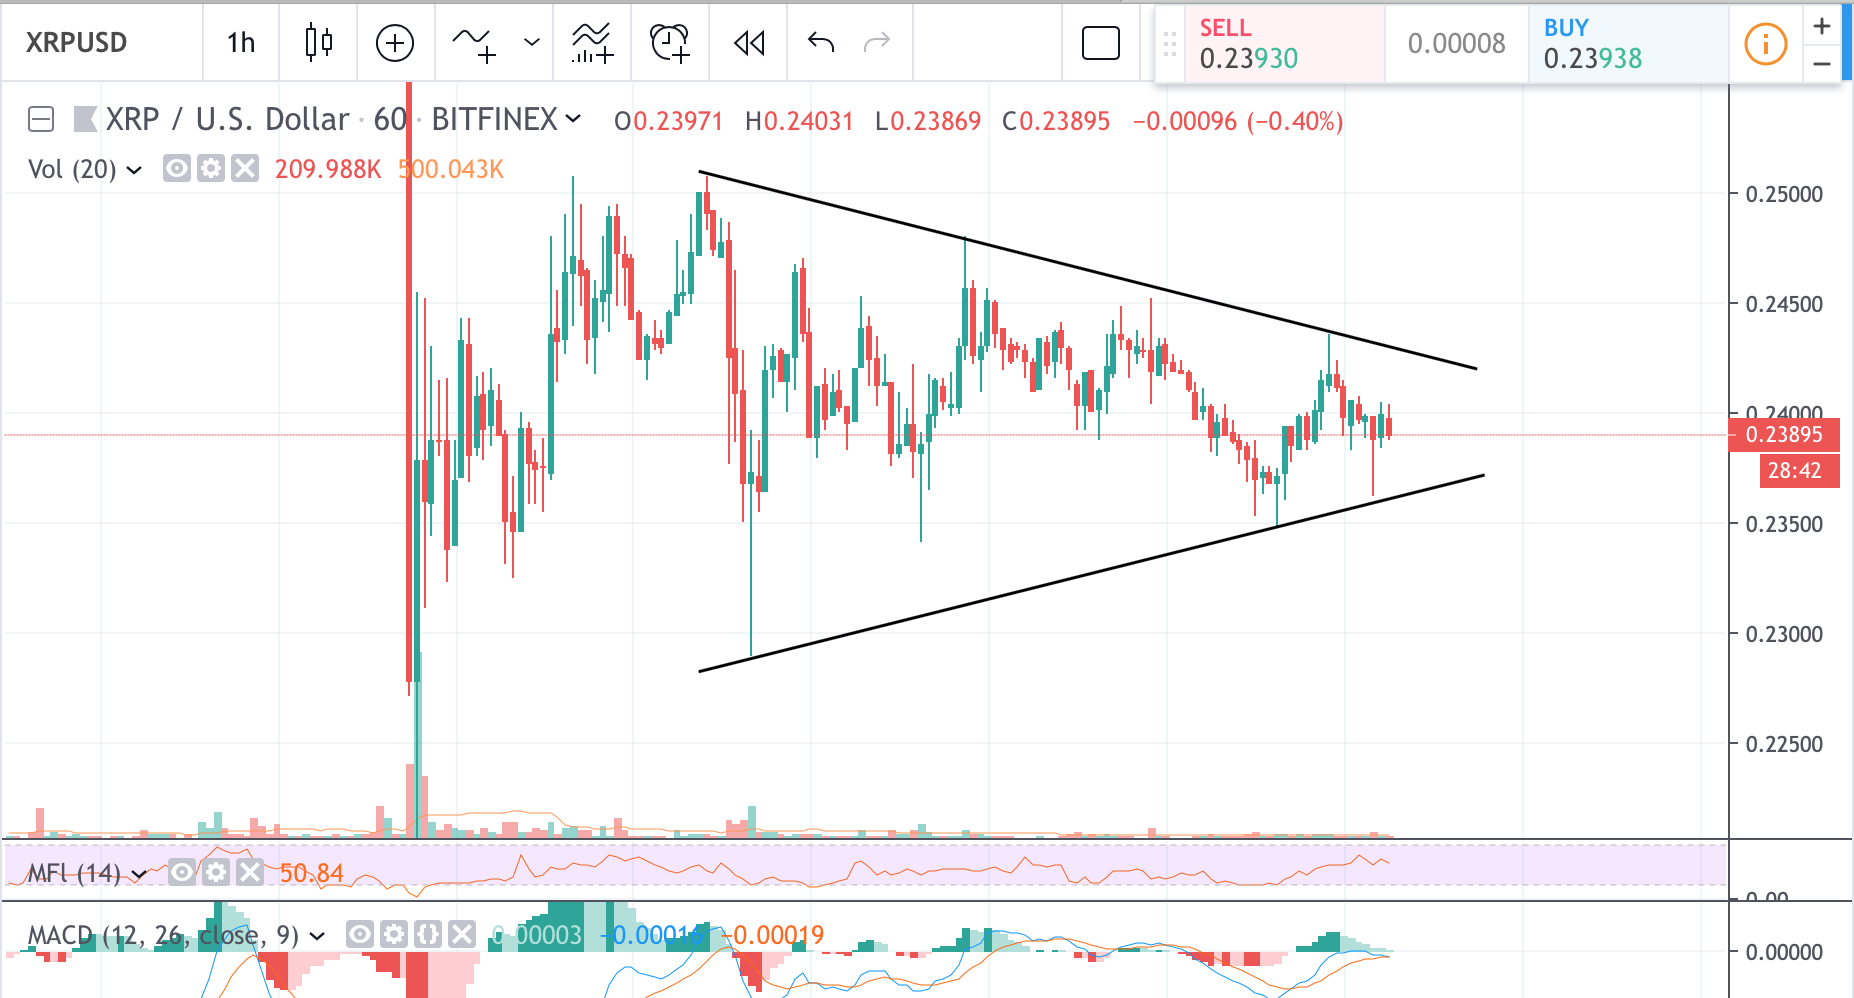
XRP price movements clearly demonstrate a narrowing trading channel. The current support line is at $0.23600, future support is at the line of $0.23400. The resistance line is at $0.24350, with possible future resistance of $0.24650. If the price remains inside the channel it is expected to touch support at around $0.23700-$0.23800 levels and subsequently not move higher then $0.24300. Once those levels are reached and tested price will most likely move on high volume and high momentum.
Long term oscillators like MACD and RSI are either showing decreasing bearish pressure or remain neutral at the moment. There are several long-tail candlesticks on a daily trading chart suggesting a possible trend reversal. One was formed on the 14th of August on a higher than average trading volume. A more recent one was printed on the 24th of September. It may be an indicator of price moving upwards from the current channel rather than decrease further.
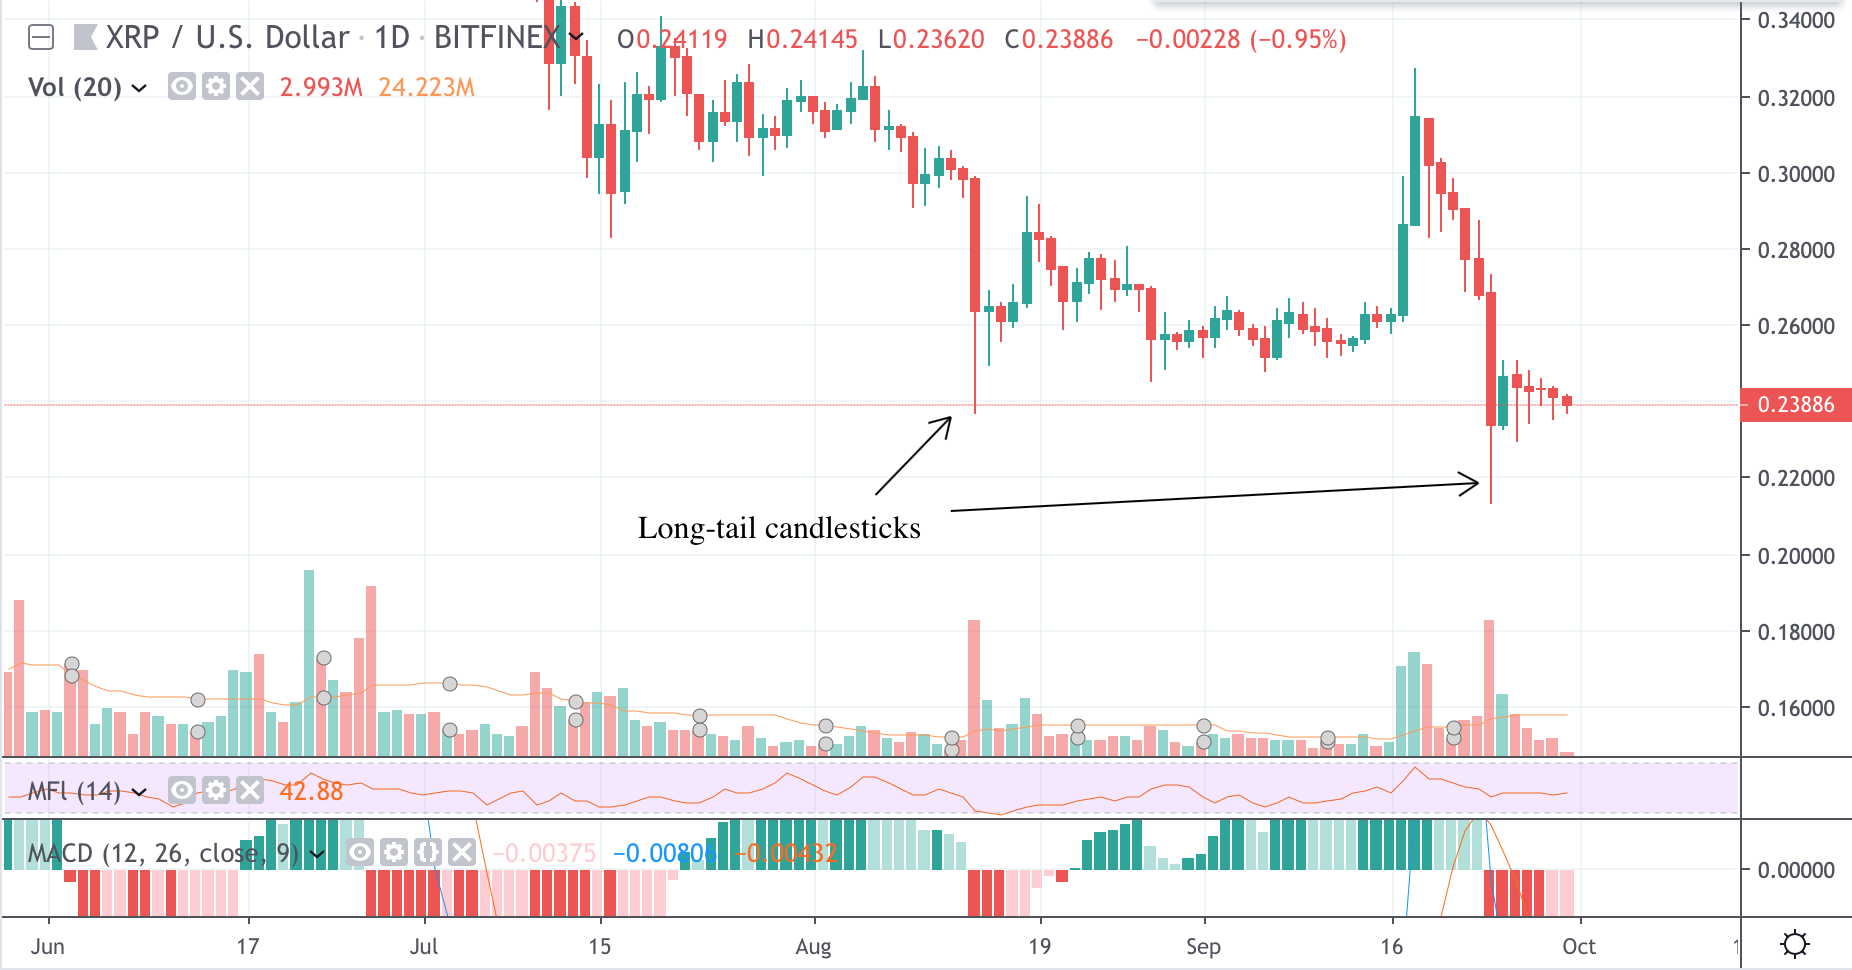
Chart source: Tradingview
Disclaimer: Markets, instruments, and advice on this page are for informational purposes only and should not in any way come across as a recommendation to buy or sell in these assets. You should do your own thorough research before making any investment decisions. Ripplecoinnews does not in any way guarantee that this information is free from mistakes, errors, or material misstatements. Investing in Cryptocurrencies involves a great deal of risk, including the loss of all or a portion of your investment, as well as emotional distress. All risks, losses, and costs associated with investing, including total loss of principal, are your responsibility.


Volatility Shares Launches First-Ever XRP Futures ETF On Nasdaq

XRP Has Officially Dethroned Tether Amid $1.2B Korean Volume

Ripple And XRP Receive Global Recognition As Mentioned In IIF’s BIS Response

Whale Alert: Bithumb Receives 20,000,000 XRP From An Unknown Wallet

XRP Futures Open Interest Registers $1B Rise In The Last Week


Solana Blew Up—These 3 Underrated Altcoins Could Be Next in Line for 10,000% Gains!
After Solana’s incredible ascent, the spotlight is shifting to lesser-known cryptocurrencies that might be ready to soar. Three undervalued altcoins...

Under $1 and Primed to 1000x: The Altcoin Solana and Cardano Whales Are Quietly Buying Ahead of the Summer Surge!
Major investors are secretly acquiring a little-known cryptocurrency priced under a dollar, expecting a major surge this summer. Holders of...

Ethereum to $10K? XRP to $7? This New Altcoin Is Forecasted to Outperform Both!
Some analysts predict that major cryptocurrencies like Ethereum and XRP might soon hit impressive new price points. Yet, whispers in...


$TOKERO LevelUP Token is about to take over the crypto market mindshare!
TOKERO LevelUP Token Set to Transform Crypto Exchange Utility Through Innovative Multi-Ecosystem Integration The driving force behind TOKERO's revolutionary hybrid...

STG Energy Cloud Mining Platform: The Wealth Engine for Bitcoin and Solana Investments in 2025
In 2025, the cryptocurrency market is a whirlwind of volatility and opportunity. Bitcoin has dipped below $80,000 due to rumors...
