Technical Analysis
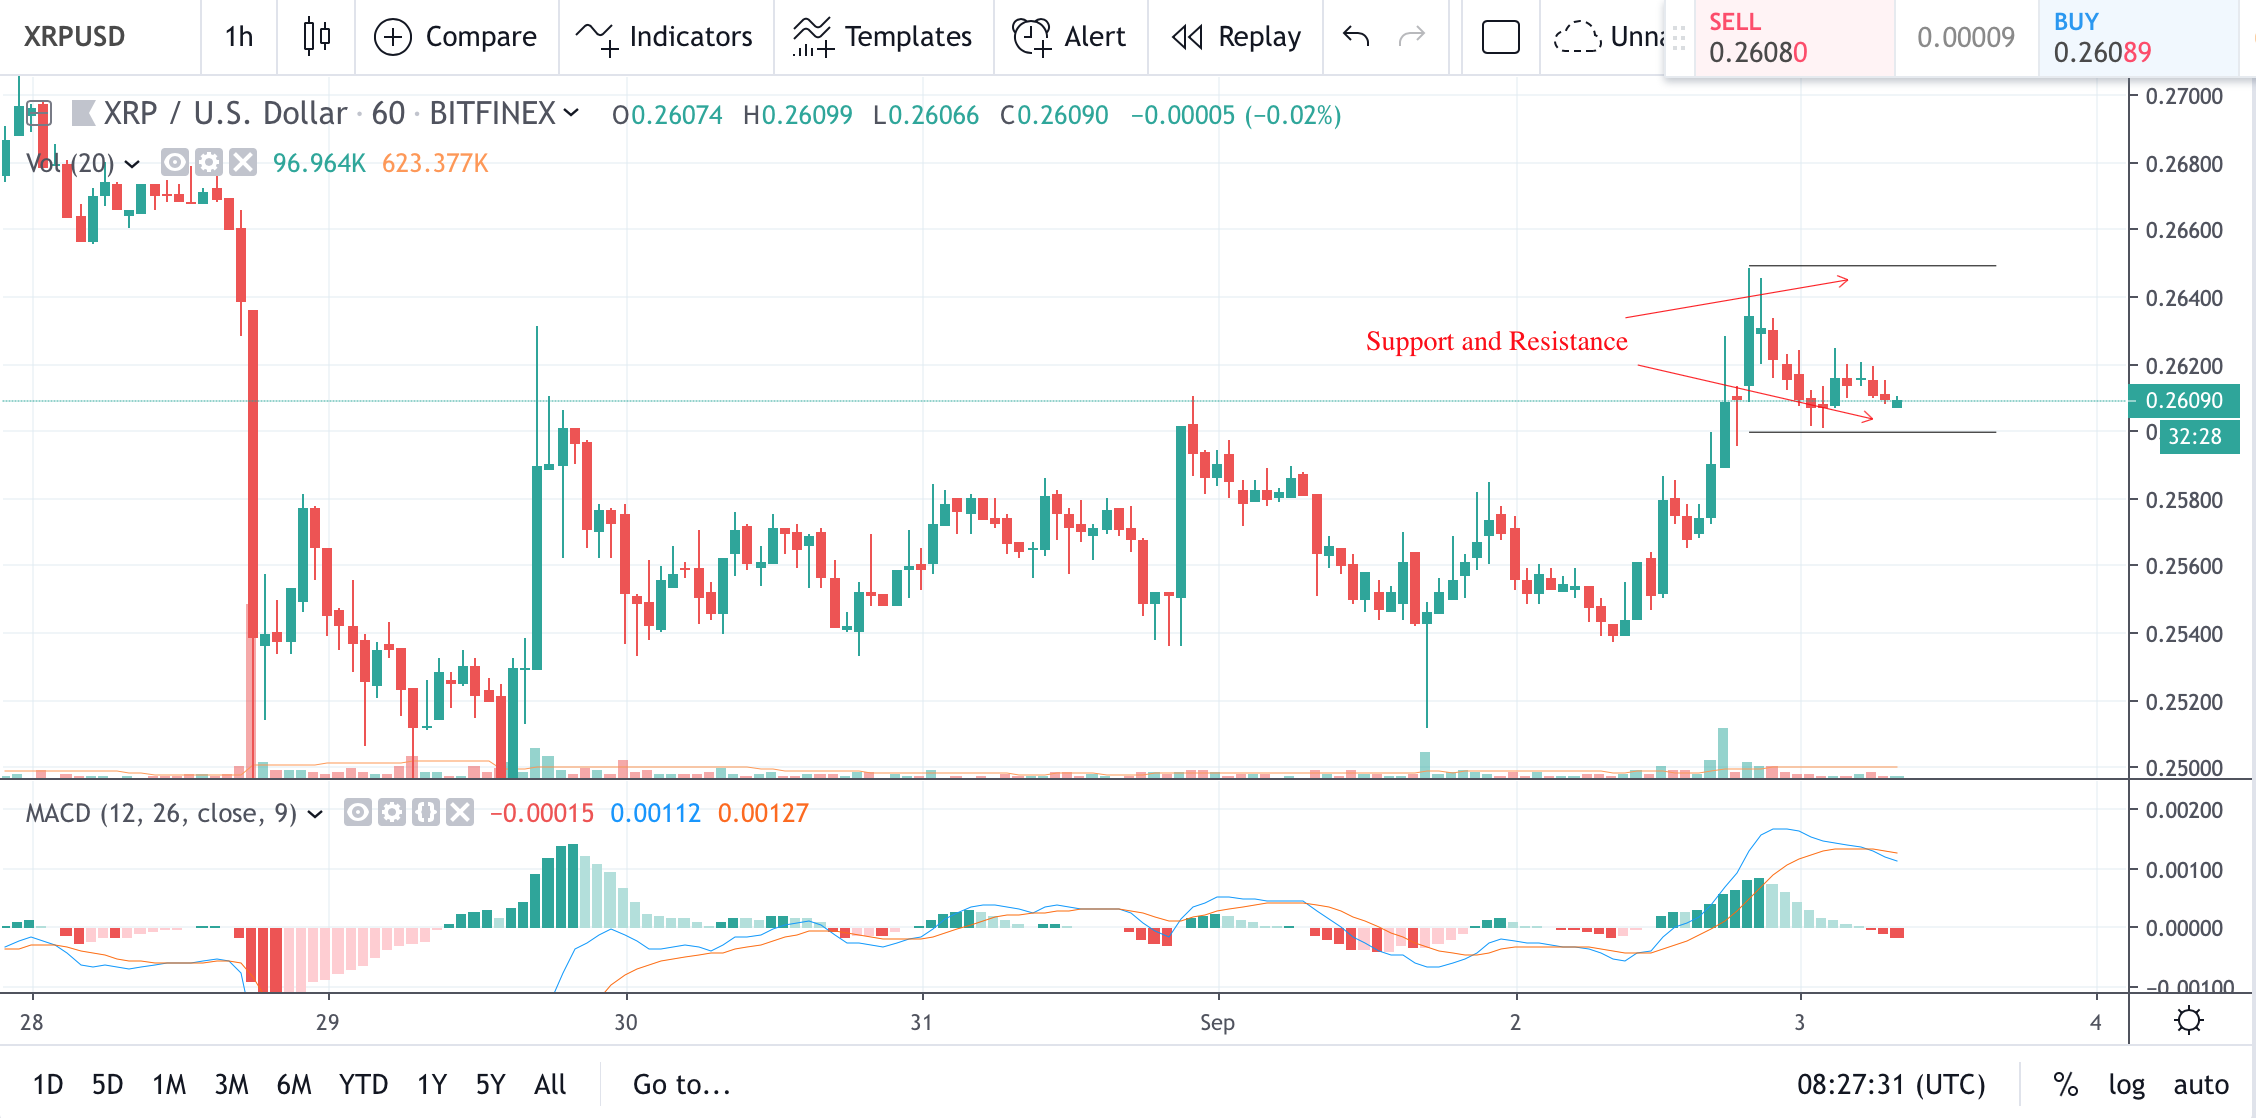
XRP/USD technical analysis. Small gains ahead of future uptrend?

- XRP price is trading sideways after gaining around 2% in the last 24 hours
- RSI and MACD indicators are neutral/slightly bearish
- The current support is $0.2600, resistance is $0.2650
1 Hour XRP/USD price chart

XRP finally gained some momentum and was able to go up from previous resistance of $0.25750 to $0.26500. Immediate retracement followed that move and new support and resistance levels were set at $0.2600 and $0.2650 respectively.
In the short term Ripple’s XRP is expected to continue its sideways movement hitting both support and resistance levels in the process.
In the long term, XRP will still need to break above $0.2650 for bulls to regain control of the market.
Chart source: Tradingview
Disclaimer: Markets, instruments and advices on this page are for informational purposes only and should not in any way come across as a recommendation to buy or sell in these assets. You should do your own thorough research before making any investment decisions. Ripplecoinnews does not in any way guarantee that this information is free from mistakes, errors, or material misstatements. Investing in Cryptocurrencies involves a great deal of risk, including the loss of all or a portion of your investment, as well as emotional distress. All risks, losses and costs associated with investing, including total loss of principal, are your responsibility.


