Technical Analysis
Ripple Technical Analysis XRP/USD 12/05/2018
Here’s the correction we are talking about in the latest technical analysis, it started. The psychological resistance area of $10,000 on Bitcoin could not be broken up to the main resistance of $12,000. Corrective movement was accelerated by the negative news published yesterday. In conclusion, Bitcoin’s first support area was crashed down. Bitcoin had a support area ranging from $8700-9000. Because of this, the entire Crypto Market is in a fairly fragile period.
A too big drop in the Bitcoin price can change the market sentiment at this point. Already, at this point, there is an alteration of the feeling of optimism. We can easily move from optimism to pessimism. However, a big drop in Bitcoin’s price will not be in the interest of whales running Crypto Market.
The resistance lines are: The support lines are:
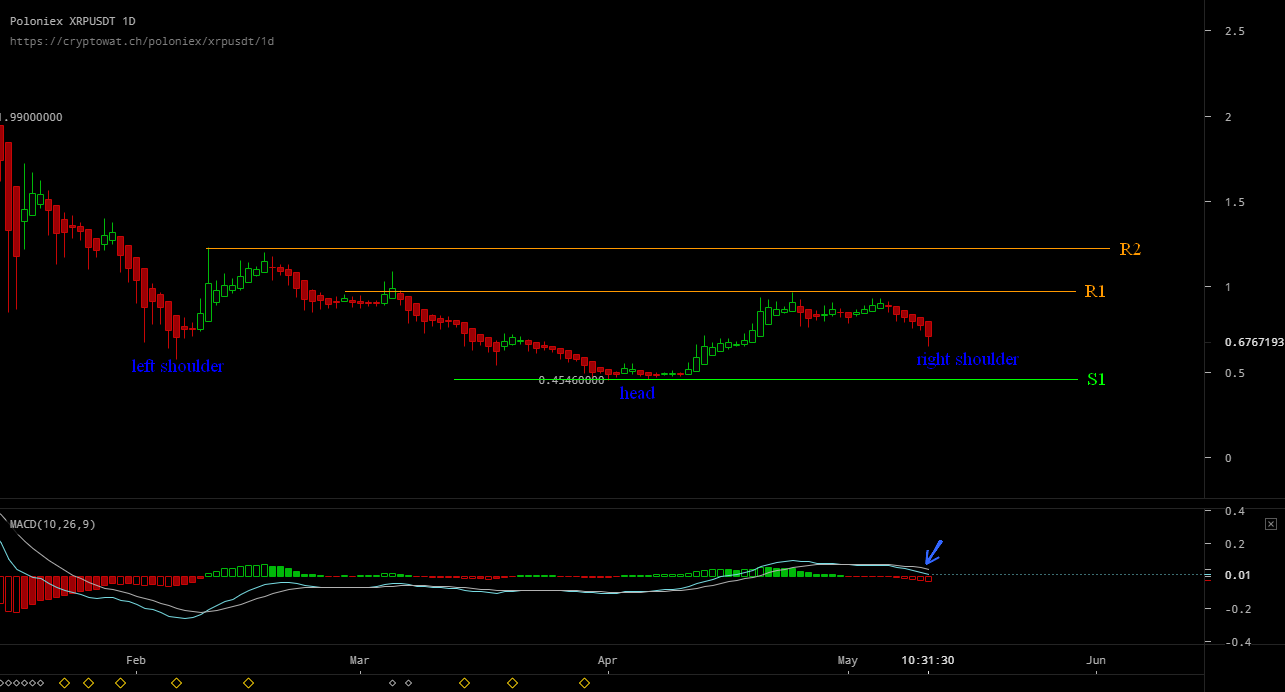
R1 – $1 (psychological) S1 – $0,45
R2 – $1,25 S2 – $0.30
R3 – $1,4
What’s happening on XRP / USD next week?
Just like Bitcoin, on XRP / USD, the support area at $0.75 was broken down. If the Bitcoin price stops somewhere in the $7500-8000 area and starts a new upward move, it will be fine. Theoretically, Bitcoin and XRP should now form the right shoulder of the reversed Head and Shoulders pattern. If this pattern is confirmed on the chart in the coming months, we will benefit from a bull run.
If the XRP / USD price stops somewhere in the $0.55 zone and starts a new upward move, it will be fine. The reversed Head and Shoulders pattern will be confirmed in this way. At the moment, we have no sign that the fall has stopped. Probably in the next few days, we will go down somewhat, and then we will have a stabilization and then an increase.
The MACD tool tells us a selling period, and the approach to line 0 indicates a weakening of the bulls force.


Flareonix Airdrop Is LIVE! Claim Your Share of 100M FXP Today!

Volatility Shares Launches First-Ever XRP Futures ETF On Nasdaq

XRP Has Officially Dethroned Tether Amid $1.2B Korean Volume

Ripple And XRP Receive Global Recognition As Mentioned In IIF’s BIS Response

Whale Alert: Bithumb Receives 20,000,000 XRP From An Unknown Wallet

Solana Blew Up—These 3 Underrated Altcoins Could Be Next in Line for 10,000% Gains!
After Solana’s incredible ascent, the spotlight is shifting to lesser-known cryptocurrencies that might be ready to soar. Three undervalued altcoins...

Under $1 and Primed to 1000x: The Altcoin Solana and Cardano Whales Are Quietly Buying Ahead of the Summer Surge!
Major investors are secretly acquiring a little-known cryptocurrency priced under a dollar, expecting a major surge this summer. Holders of...

Ethereum to $10K? XRP to $7? This New Altcoin Is Forecasted to Outperform Both!
Some analysts predict that major cryptocurrencies like Ethereum and XRP might soon hit impressive new price points. Yet, whispers in...


$TOKERO LevelUP Token is about to take over the crypto market mindshare!
TOKERO LevelUP Token Set to Transform Crypto Exchange Utility Through Innovative Multi-Ecosystem Integration The driving force behind TOKERO's revolutionary hybrid...

STG Energy Cloud Mining Platform: The Wealth Engine for Bitcoin and Solana Investments in 2025
In 2025, the cryptocurrency market is a whirlwind of volatility and opportunity. Bitcoin has dipped below $80,000 due to rumors...
