Technical Analysis
Ripple Technical Analysis XRP/USD, XRP/BTC 05/07/2018
From the News
So there comes Codius and the market is abuzz. Remember, back in 2015, this project was phased out because then the market was still at infancy and worse still, different ledgers had their own standards. In short there were no standards meaning inter-operability and value transfer between different chains wasn’t possible. Now, with InterLedger, Codius has been revived and in beta stage being debugged. Codius is a smart contract and DApp platform that runs on Ripple’s infrastructure complete with an in-built billing system that makes it possible for web or app monetization.
As if Codius wasn’t enough, news of BankDhofar joining the RippleNet and showing their desire to be part of this one big web of seamless and instantaneous buoyed the market. Already, Ripple is spreading their tentacles not only in South East Asia but in Europe and China where they are urging banks and offering irresistible deals which facilitates seamless value transfer internationally.
On the exchanges, traders can now buy and sell XRP/USDT on Binance. Shortly after this announcement was made, XRP surged eight percent in less than an hour. That was not all, this announcement also made the XRP/BTC pair the most liquid on the market offering traders or even general investors a leeway to a safe haven in times of market instability.
Ripple (XRP/USD) Technical Analysis
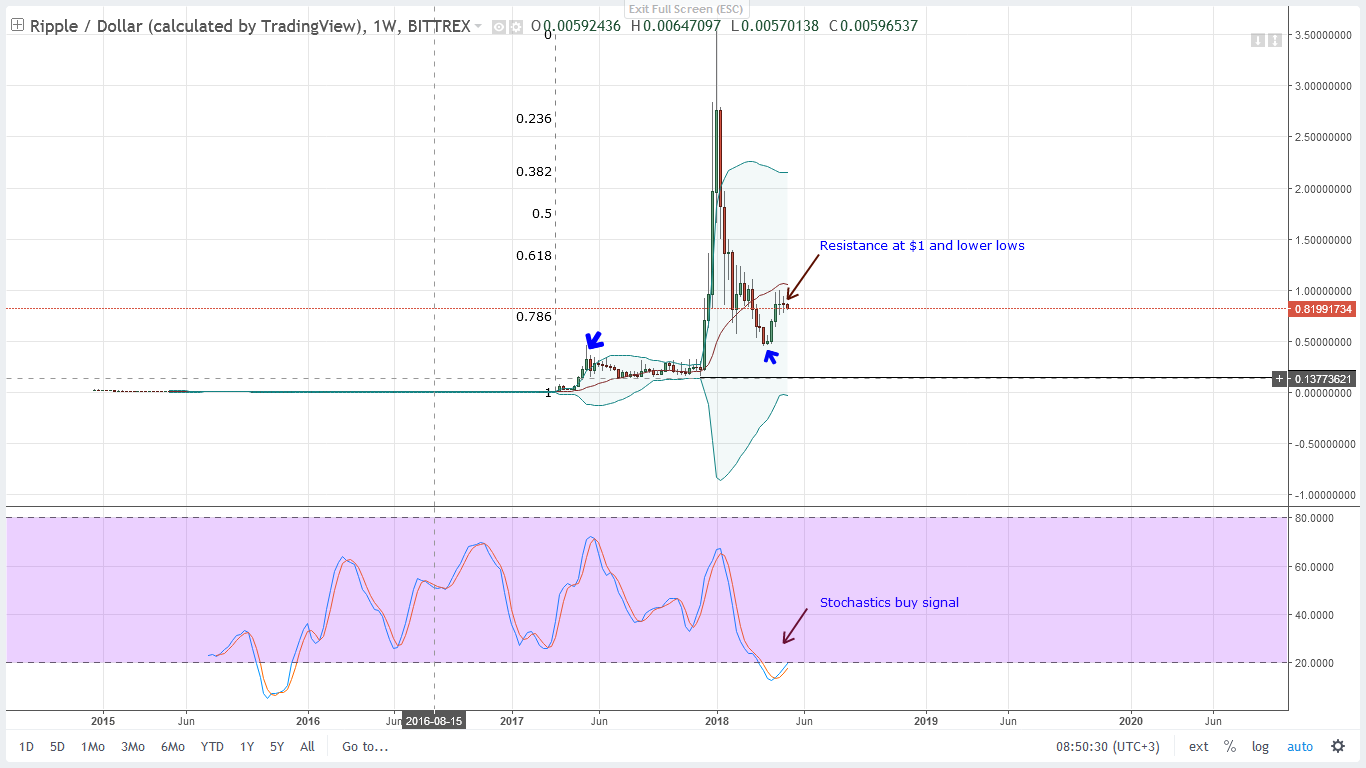
In the last seven days, Ripple (XRP) is down four percent. That goes on to show you how slow the market has been the past two or three weeks. As visible in the weekly chart, we have this subtle lower lows and prices are finding obvious resistance at $1. Regardless, we still hold to our bullish projections because of that stochastic buy signal in the weekly chart as we wait for better signals in lower time frames. For now though, traders can search for sell opportuntities in lower time frames.

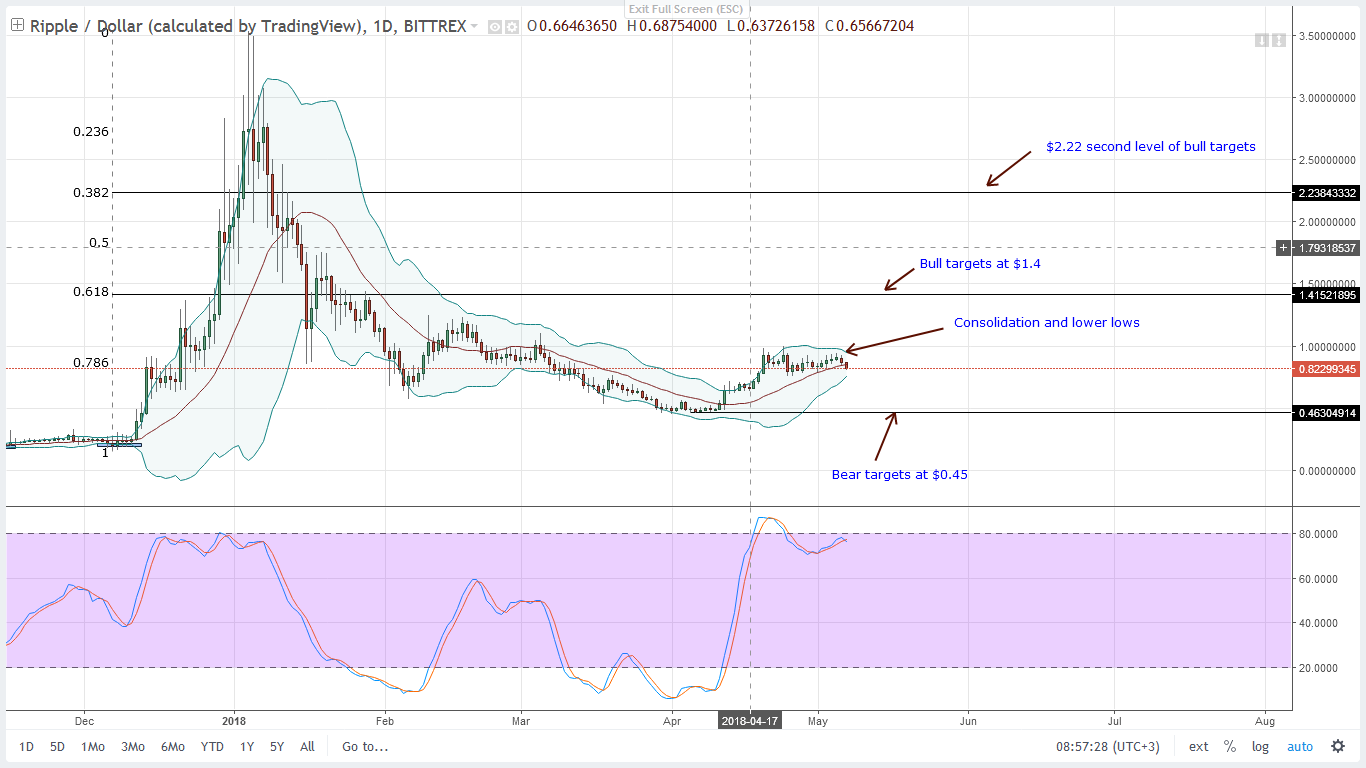
Evidently, prices are still stuck in a range mode with bears testing the middle BB in the daily chart. In my view, it is highly likely that sellers might break below 75 cents as they trade with that bearish divergence pattern and a stochastic sell signal in the daily chart. Overly, any sustained close below 75 cents means selling with immediate targets at 70 cents and 45 cents in the short to medium term.
Ripple (XRP/BTC) Technical Analysis

The 9500 satoshi level is proving a key resistance line and like the USD pair, we have this lower lows but in this case, week ending April 23 candelstick is price action’s short term high low. Going forward, we are net bullish but intermittently, seller might end up driving prices lower. In that regard, finding selling signals in lower time frames can prove a good strategy.
In the daily chart we have this nice lower lows complete with a stochastic sell signal. That’s not all, there seems to be a correction stemming from that over-extension on April 21 where 80 percent of a bear candlestick closed above the upper BB. In my view, safe the consolidation, this correction was inevitable. Additionally, we can see a bear a break below the middle BB. With sellers testing April 25 lows of 8600 satoshis, any bearish break-down below this 10 day consolidation will be inviting for bears who in turn shall be angling for 6900 satoshis on the lower end.


Ripple (XRP) And Solana (SOL) Set To Lead Altcoin Season: Can ETFSwap (ETFS) Make A 100X Return?

Ripple (XRP), ETFSwap (ETFS), And Ondo Finance (ONDO) Are Leading The Crypto ETF Economy

Ripple CEO Says XRP ETF Is Coming – Here’s How To Position For This Bullish Event

Bitcoin’s Value Climbs Above $71,000 Ahead of Impending Halving Event

Best Bitcoin Miners in 2024
Ripple (XRP) And Solana (SOL) Set To Lead Altcoin Season: Can ETFSwap (ETFS) Make A 100X Return?
Prominent analysts and experts are predicting a soon-to-come surge in the crypto market, and popular altcoins Ripple (XRP) and Solana...
Ripple (XRP), ETFSwap (ETFS), And Ondo Finance (ONDO) Are Leading The Crypto ETF Economy
ETFSwap (ETFS), along with Ripple (XRP) and Ondo Finance (ONDO), is spearheading the dynamic crypto ETF economy, paving the way...
Ripple CEO Says XRP ETF Is Coming – Here’s How To Position For This Bullish Event
Ripple CEO, Brad Garlinghouse, has suggested the possibility of an XRP ETF being approved by governmental authorities soon. He made...


BlockDAG’s Visionary Leap: Sparking a Crypto Revolution with 5000% ROI Potential
BlockDAG’s groundbreaking announcement has stirred a wave of excitement in the cryptocurrency community, following its keynote presentation broadcasted across the...


Earn Passive Income Quickly with ARKMining Cloud Mining – Daily Profits
ARKMining, a leading cloud mining platform, recently released a complete analysis report demonstrating its potential to help individuals easily earn...
