Technical Analysis
Ripple (XRP) price analysis: Closer to the end of the symmetrical triangle, which way will price break out?
XRP is one of the biggest alternate coins by market cap, currently being ranked #2 by market capitalization by Coinmarketcap right after Bitcoin. At the time of writing, XRP has a total market cap of $13,125,093,706. The company announced today that 13 financial institutions have agreed to use the network provided by Ripple: Ripplenet. The financial institutions are: SendFriend, FTCS, JNFX, Euro Exim Bank, Transpaygo, Connect Pay, Ahli Bank of Kuwait, GMY, BFC Bahrain, Olympia Trust Company, WorldCom Finance, Rendimento and Pontual. Therefore, the number of companies that use Ripplenet is now bigger than 200.
Long-Term Outlook
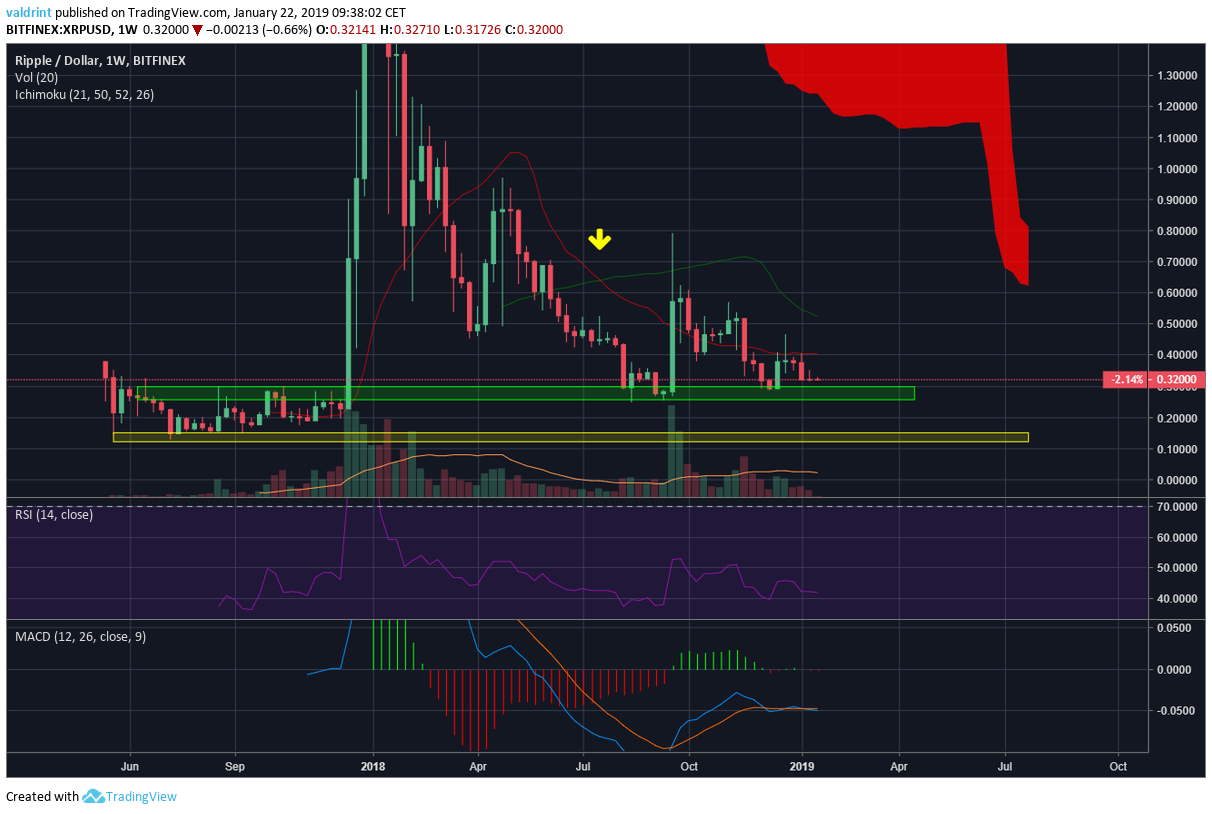
A look at the Weekly chart for XRP shows that price fell all the way down to the support area at $0.27-0.30 before starting an upward rally. Price has retraced again and is currently trading at $0.32. If the support area does not hold, the next support area is found at $0.11-0.15 (yellow rectangle). Price is facing resistance from the 7 and 21 period moving averages plus the Ichimoku Cloud. Furthermore, the 7 and 21 period moving averages made a bearish cross in July 2017. While price tried to break out of the MAs twice, both attempts ended unsuccessfully. The RSI is at 42, indicating neither oversold nor overbought conditions. Similarly, the MACD has shown very little movement and is stuck between making a bearish or bullish cross.
Medium-Term Outlook
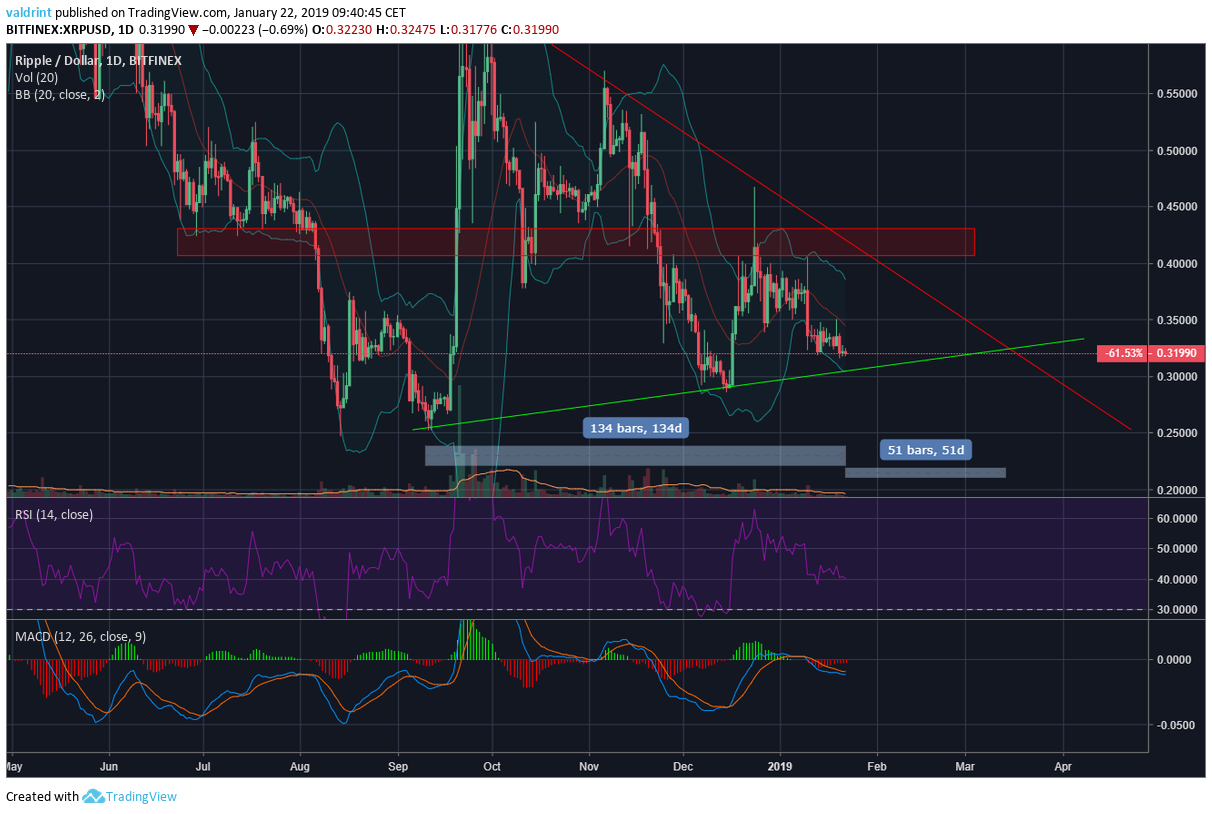
A look at the Daily chart for XRP gives us a structure in which price is trading in. Price has been moving in a symmetrical triangle for the past 134 days since September 2017. It is very close to moving to the support line of the triangle. Furthermore, price is almost below the lower bound of the Bollinger Bands, indicating a reversal. The first area of resistance coincides with the red resistance line at $0.4. The end of the triangle is still 51 days away.
Short-Term Outlook
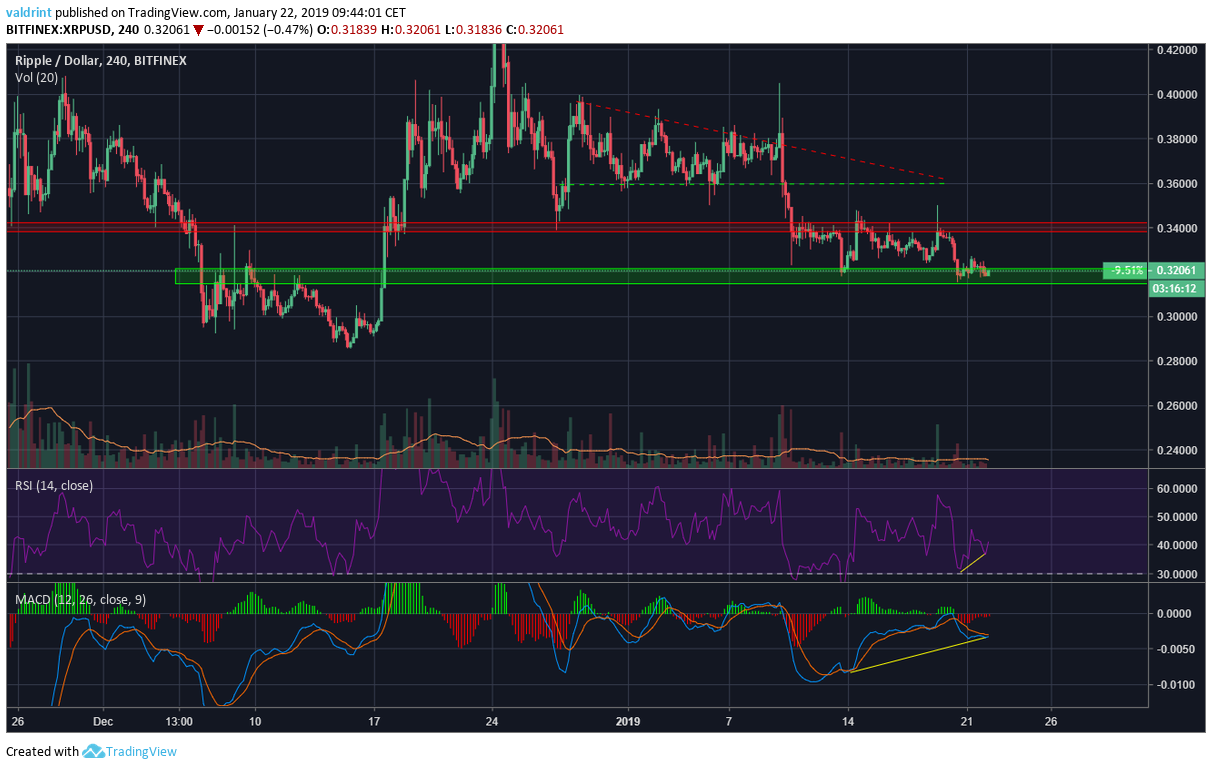
A look at the 4-hour chart for XRP gives a little more information about where price might be headed. Price is currently in the small support area formed by previous highs at $0.32, after falling from the descending triangle (dashed line). Furthermore, there is bullish divergence developing in both the RSI and the MACD, a sign of reversal. The next area of small resistance is at $0.34. Therefore, I believe that price is likely to test this area in the short-term before trying to make a rally up to the main resistance area at $0.4.
Conclusions
- Price is close to the support area at $0.3
- Price is moving in a symmetrical triangle
- Indicators shows indecision


Ripple (XRP) And Solana (SOL) Set To Lead Altcoin Season: Can ETFSwap (ETFS) Make A 100X Return?

Ripple (XRP), ETFSwap (ETFS), And Ondo Finance (ONDO) Are Leading The Crypto ETF Economy

Ripple CEO Says XRP ETF Is Coming – Here’s How To Position For This Bullish Event

Bitcoin’s Value Climbs Above $71,000 Ahead of Impending Halving Event

Best Bitcoin Miners in 2024
Ripple (XRP) And Solana (SOL) Set To Lead Altcoin Season: Can ETFSwap (ETFS) Make A 100X Return?
Prominent analysts and experts are predicting a soon-to-come surge in the crypto market, and popular altcoins Ripple (XRP) and Solana...
Ripple (XRP), ETFSwap (ETFS), And Ondo Finance (ONDO) Are Leading The Crypto ETF Economy
ETFSwap (ETFS), along with Ripple (XRP) and Ondo Finance (ONDO), is spearheading the dynamic crypto ETF economy, paving the way...
Ripple CEO Says XRP ETF Is Coming – Here’s How To Position For This Bullish Event
Ripple CEO, Brad Garlinghouse, has suggested the possibility of an XRP ETF being approved by governmental authorities soon. He made...


BlockDAG’s Visionary Leap: Sparking a Crypto Revolution with 5000% ROI Potential
BlockDAG’s groundbreaking announcement has stirred a wave of excitement in the cryptocurrency community, following its keynote presentation broadcasted across the...


Earn Passive Income Quickly with ARKMining Cloud Mining – Daily Profits
ARKMining, a leading cloud mining platform, recently released a complete analysis report demonstrating its potential to help individuals easily earn...
