Technical Analysis
Ripple (XRP) Price Analysis: The symmetrical triangle is invalidated, is a double bottom in store?
XRP is one of the biggest alternate coins by market cap, currently being ranked #2 by market capitalization by Coinmarketcap right after Bitcoin. At the time of writing, XRP has a total market cap of $12,005,463,898. It enjoy numerous partnerships, and recently Euro Exim Bank, said they are planning to use Xcurrent in order to support a finance system that could replace SWIFT. The company’s head of operations and compliance, Graham Bright said: Ripple has until now focused xCurrent on payments messaging. Now we are preparing to trial a capability that will embed instructions of trade finance into Xcurrent. This enjoys many similarities to that which SWIFT offers, but instead is done on a blockchain-based network, that will allow for exchanges without any middlemen.
Long-Term Outlook
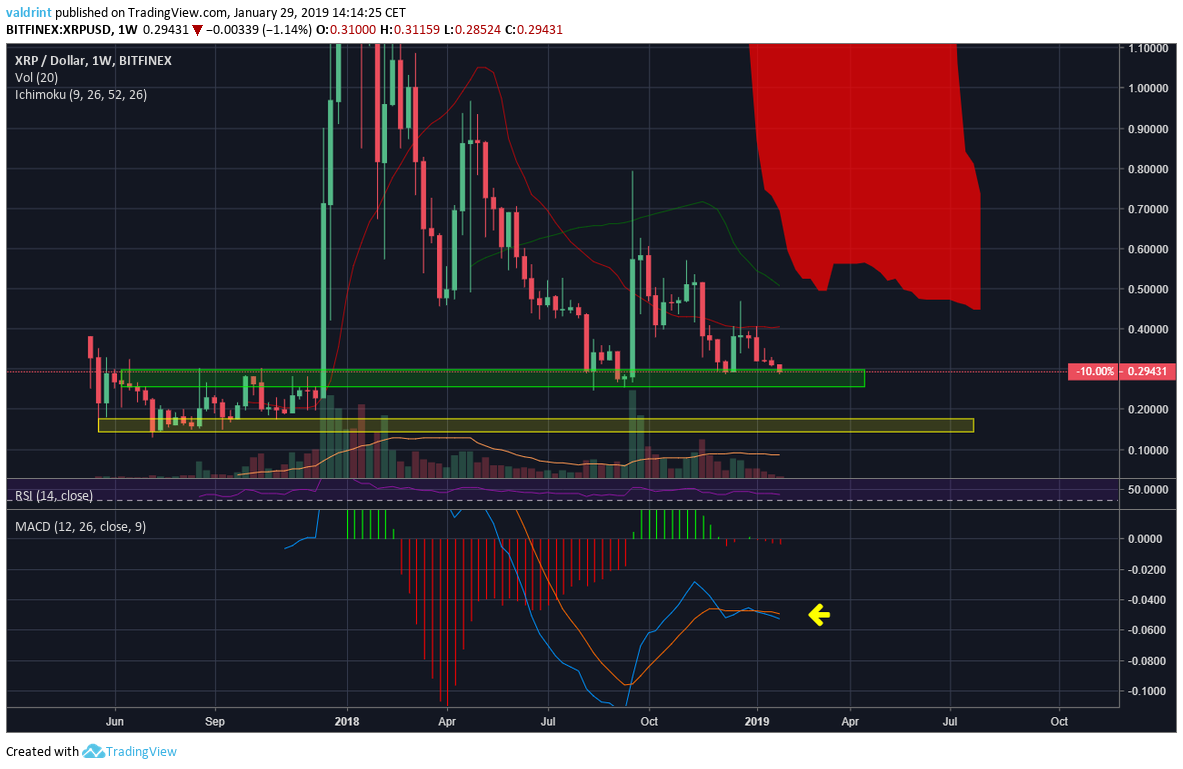
A look at the Weekly chart for XRP shows that price is currently trading at $0.29, within the support area of $0.27-$0.30 which has been standing for almost a year. If the support does not hold price, the next area of support will be found at $0.14-$-0.17. As for the moving averages, rice is currently trading below the 7, 21 period MAs and the Ichimoku cloud, and is facing very close resistance from the 7-period moving average. Furthermore, the MACD is showing signs of weakness, starting to fall with increasing volume after a long period of consolidation. The RSI is at 45, indicating neither oversold nor overbought conditions.
Medium-Term Outlook
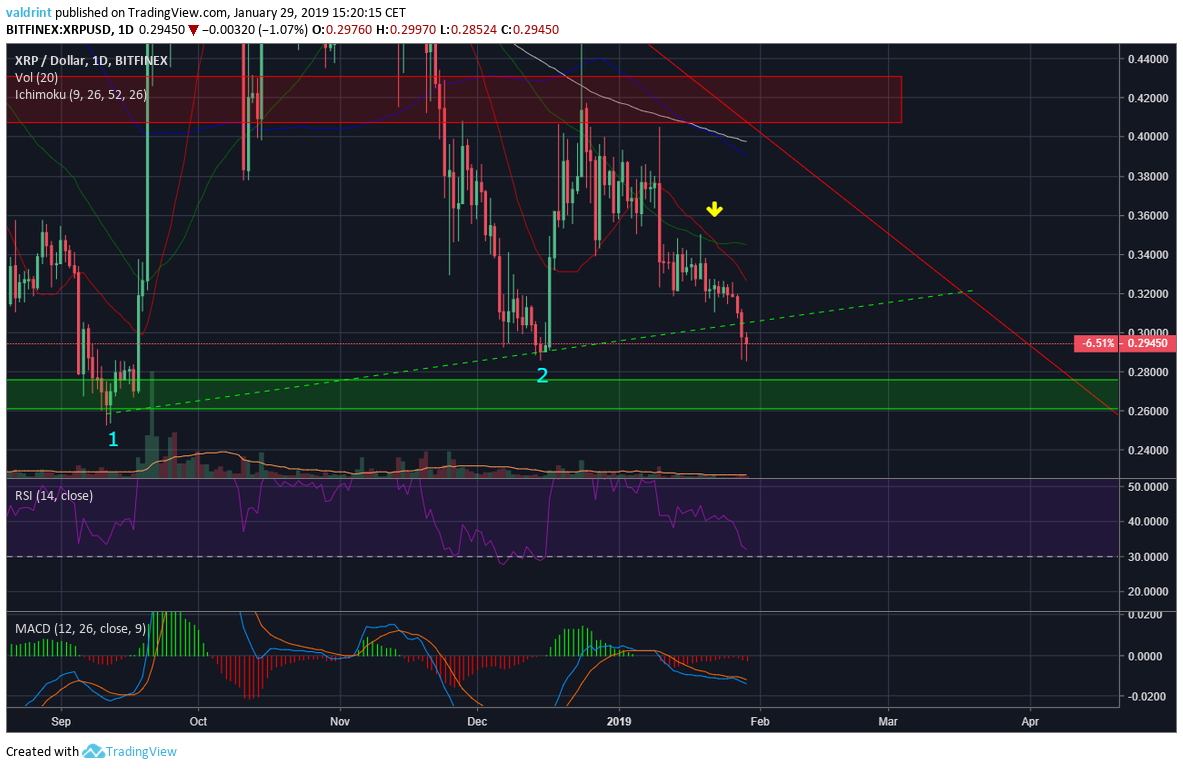
A look at the Daily chart gives us a possible structure in which price is trading in. We can see that price has broken down from the symmetrical triangle it was supposedly trading in. However, since the trend line has not been properly validated (only touched twice) and the breakdown occurred in very small volume, this pattern is invalidated and we should wait for price to fall to the support area before making another move. Price is trading below all the moving averages, and the 7-21 period Mas have made a bearish cross. Furthermore, the MACD has rejected a bullish cross and is now falling with increased volume. The RSI is at 32, indicating neither overbought nor oversold conditions. The most significant area of resistance is found at $0.40-$0.43.
Short-Term Outlook
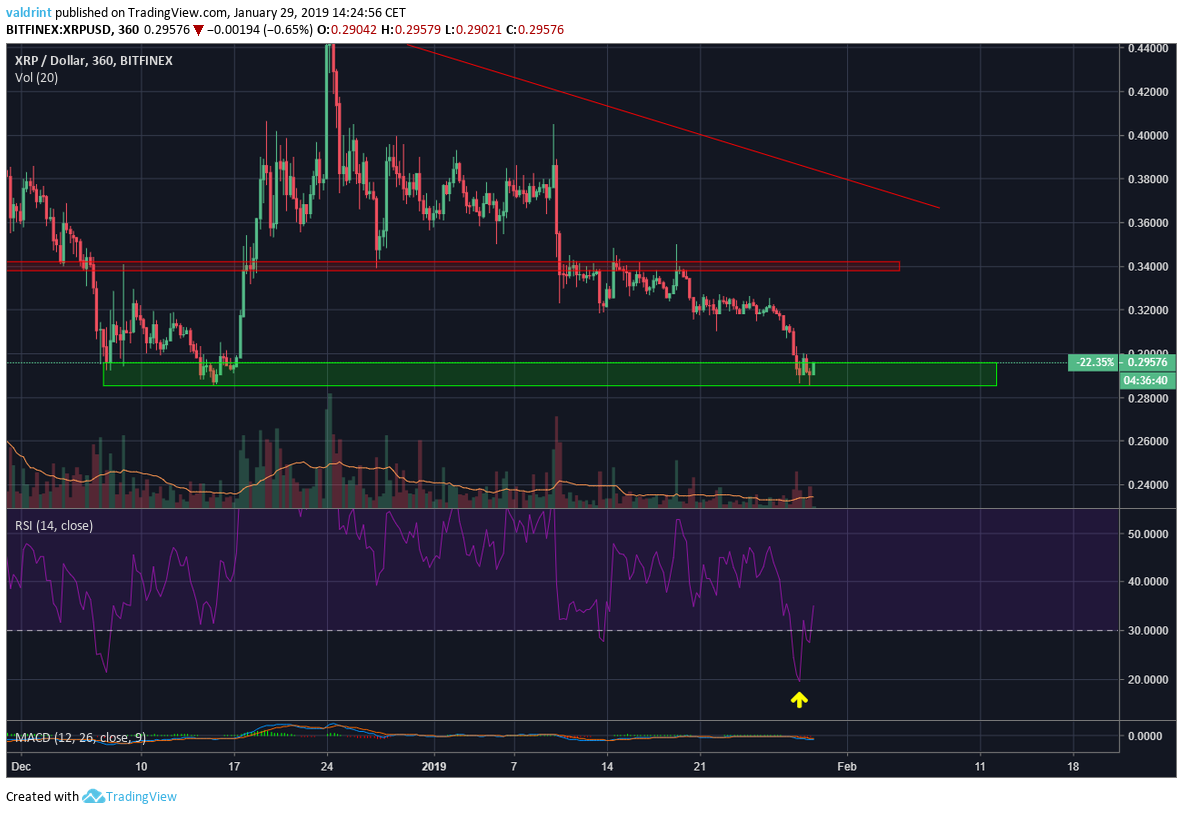
A closer look at the 6-hour chart shows that price has retraced 100% from the initial upward move from $0.28 (December 18) to $0.45 (December 24). Price tried to break through the resistance at $0.35 several times but was unsuccessful. The RSI has not developed any significant bullish divergence, but was into deep oversold territory for a short-period. The RSI is now at 34.
Conclusions
- Price is currently trading within the support area at $0.27-$0.30
- Price trading is below most moving averages in medium and long time-frames.
- The RSI has started to develop bullish divergence in short time-frames


Volatility Shares Launches First-Ever XRP Futures ETF On Nasdaq

XRP Has Officially Dethroned Tether Amid $1.2B Korean Volume

Ripple And XRP Receive Global Recognition As Mentioned In IIF’s BIS Response

Whale Alert: Bithumb Receives 20,000,000 XRP From An Unknown Wallet

XRP Futures Open Interest Registers $1B Rise In The Last Week


Solana Blew Up—These 3 Underrated Altcoins Could Be Next in Line for 10,000% Gains!
After Solana’s incredible ascent, the spotlight is shifting to lesser-known cryptocurrencies that might be ready to soar. Three undervalued altcoins...

Under $1 and Primed to 1000x: The Altcoin Solana and Cardano Whales Are Quietly Buying Ahead of the Summer Surge!
Major investors are secretly acquiring a little-known cryptocurrency priced under a dollar, expecting a major surge this summer. Holders of...


Ethereum to $10K? XRP to $7? This New Altcoin Is Forecasted to Outperform Both!
Some analysts predict that major cryptocurrencies like Ethereum and XRP might soon hit impressive new price points. Yet, whispers in...


$TOKERO LevelUP Token is about to take over the crypto market mindshare!
TOKERO LevelUP Token Set to Transform Crypto Exchange Utility Through Innovative Multi-Ecosystem Integration The driving force behind TOKERO's revolutionary hybrid...

STG Energy Cloud Mining Platform: The Wealth Engine for Bitcoin and Solana Investments in 2025
In 2025, the cryptocurrency market is a whirlwind of volatility and opportunity. Bitcoin has dipped below $80,000 due to rumors...
