Technical Analysis
Technical Analysis XRP/USD 14/09/2017

Popular post: 5 Tips To Protect Your CryptoCurrencies From Hackers
Here’s how XRP/USD has failed to keep up the downward trend line. I was saying in the latest technical analysis that the XRP/USD parity will not be able to keep above the downward trend line, if the BTC will have a downward break, the support level at $3900. Here is the BTC broke the support level at $3900 and dropped yesterday to $3740usd.
At the time I publish this analysis (h 0.15) on the BTC, there is a slight recovery. Here’s how, again, XRP/USD is synchronized with the downward movement of the BTC. Lately, any attempt to recover XRP/USD has been neutralized by Bitcoin’s downward move.
The resistance lines are: The support lines are:
R1 – $0,23usd S1 – $0,19usd
R2 – $0.30usd S2 – $0,175usd
S3 – $0,15usd
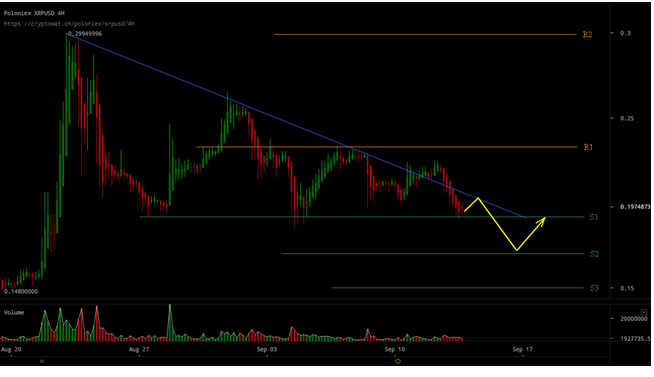
Yesterday XRP / USD tested the S1 support $0.19usd again. If the downward movement on the BTC will continue XRP/USD will break the support level S1 $0,19usd and will descend to S2 $0,175usd. However, we should know what levels of support we have on the BTC.
To what level of price can BTC come down in the short-term? The last minimum level on the BTC was $3600 (August 22). It is possible that the price will try to form a new support level at $3600. From $3600, we will probably have a recovery on the BTC. At this point, a downward trend channel was formed on the BTC. If the BTC will not form a support area at $3600usd, the next level at which it can stop is $2900usd (previous resistance area).
XRP/USD will follow BTC’s move in the coming days. A decoupling from the BTC movement can only be produced, except in the case of really good news. For the next two days, the possible evolution of the XRP/USD price is drawn in yellow on the chart.
For those who want to buy XRP/USD, a suitable strategy for the moment would be buying at certain predetermined price levels. Support levels S1- S3 are good buying areas. Money management must be very accurate. For example: buy 20% of the total amount available at S1. If the price goes down to S2, buy with 30% of the total amount. If the price goes down to S3, buy with the remaining 50%.


Volatility Shares Launches First-Ever XRP Futures ETF On Nasdaq

XRP Has Officially Dethroned Tether Amid $1.2B Korean Volume

Ripple And XRP Receive Global Recognition As Mentioned In IIF’s BIS Response

Whale Alert: Bithumb Receives 20,000,000 XRP From An Unknown Wallet

XRP Futures Open Interest Registers $1B Rise In The Last Week


Solana Blew Up—These 3 Underrated Altcoins Could Be Next in Line for 10,000% Gains!
After Solana’s incredible ascent, the spotlight is shifting to lesser-known cryptocurrencies that might be ready to soar. Three undervalued altcoins...


Under $1 and Primed to 1000x: The Altcoin Solana and Cardano Whales Are Quietly Buying Ahead of the Summer Surge!
Major investors are secretly acquiring a little-known cryptocurrency priced under a dollar, expecting a major surge this summer. Holders of...


Ethereum to $10K? XRP to $7? This New Altcoin Is Forecasted to Outperform Both!
Some analysts predict that major cryptocurrencies like Ethereum and XRP might soon hit impressive new price points. Yet, whispers in...


$TOKERO LevelUP Token is about to take over the crypto market mindshare!
TOKERO LevelUP Token Set to Transform Crypto Exchange Utility Through Innovative Multi-Ecosystem Integration The driving force behind TOKERO's revolutionary hybrid...

STG Energy Cloud Mining Platform: The Wealth Engine for Bitcoin and Solana Investments in 2025
In 2025, the cryptocurrency market is a whirlwind of volatility and opportunity. Bitcoin has dipped below $80,000 due to rumors...
