Technical Analysis
XRP is oversold according to MACD and MFI
- XRP price continued its downtrend
- The new support line is forming
- The lowest price achieved since December 2017
Daily XRP/USD price chart
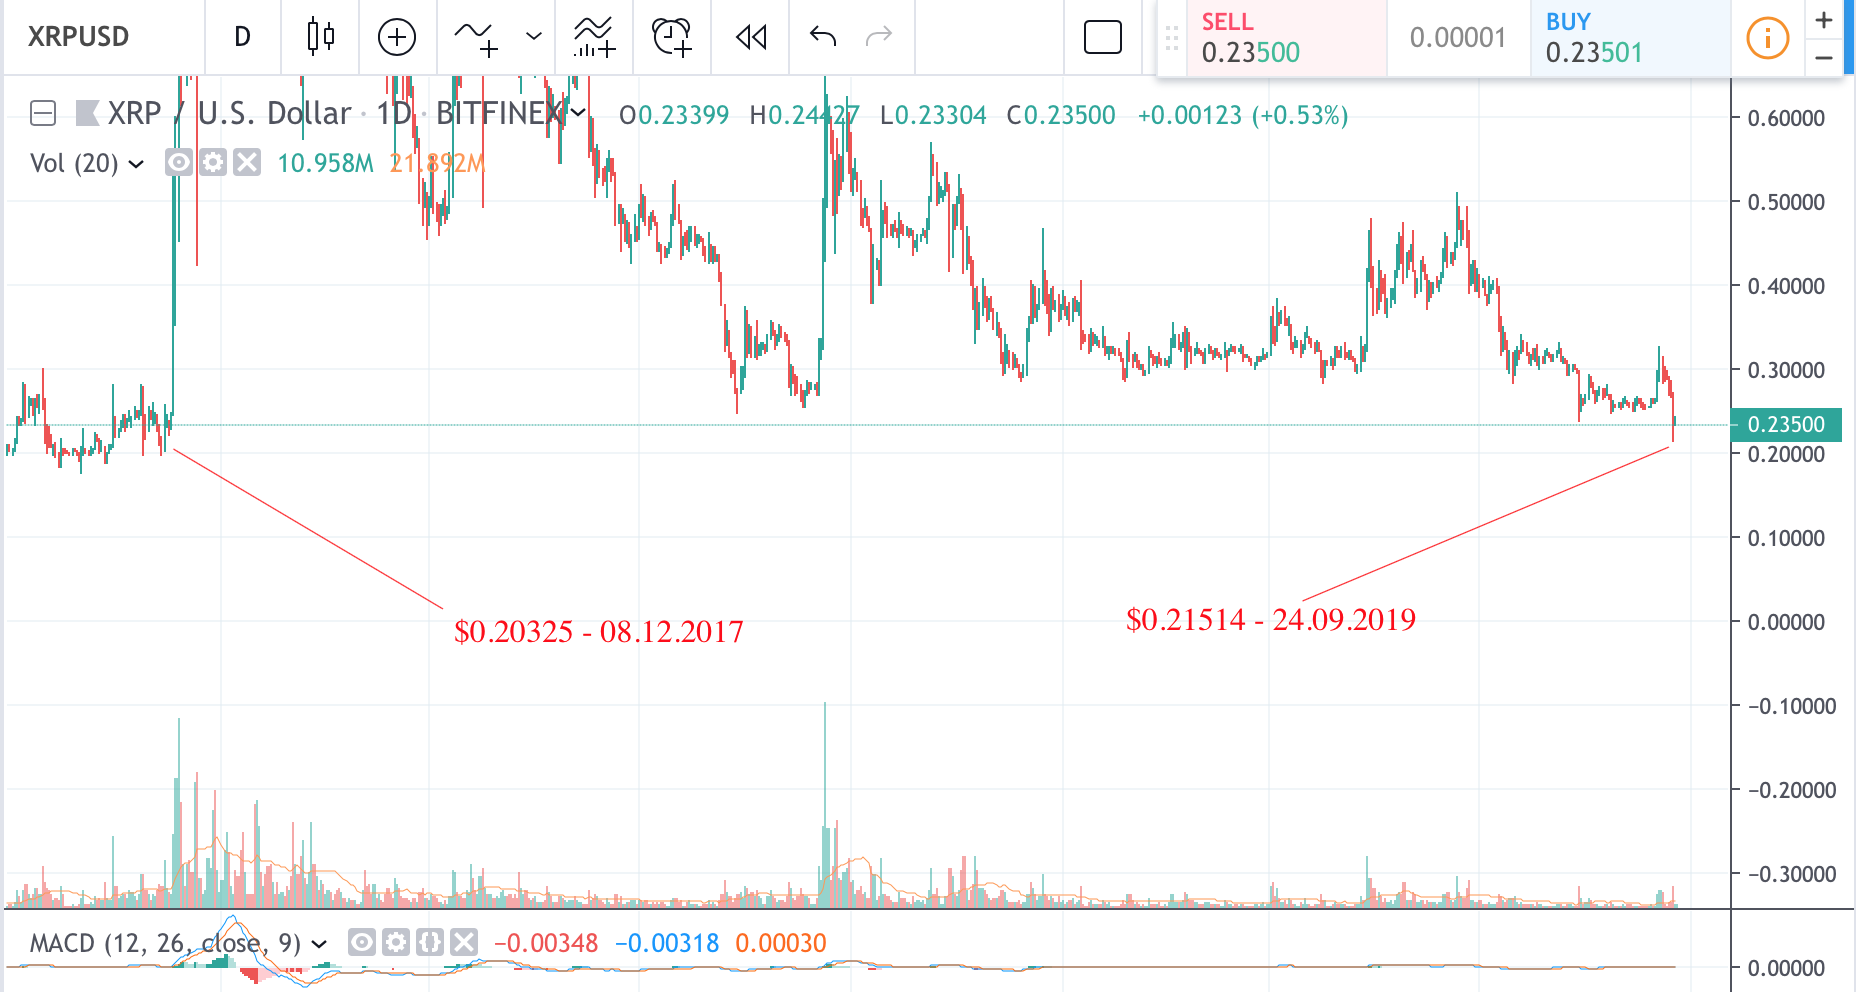
Ripple XRP, as well as all other major cryptocurrencies, recorded substantial loses in the last 24 hours. XRP price against U.S. Dollar has suffered a sharp decline from its recent high of $0.32700 set on the 18th of September. The coin now trades around $0.23700, where the new support line seems to be forming at the moment. On 24th of September 2019, XRP price went as low as $0.21514. This is the lowest XRP price since December 2017. Low tail candlestick formed during that move. Subsequently, the price moved up by 2 cents, a possible suggestion of the lack of bearish interest at that low level at the moment.
Technical indicators on a weekly chart
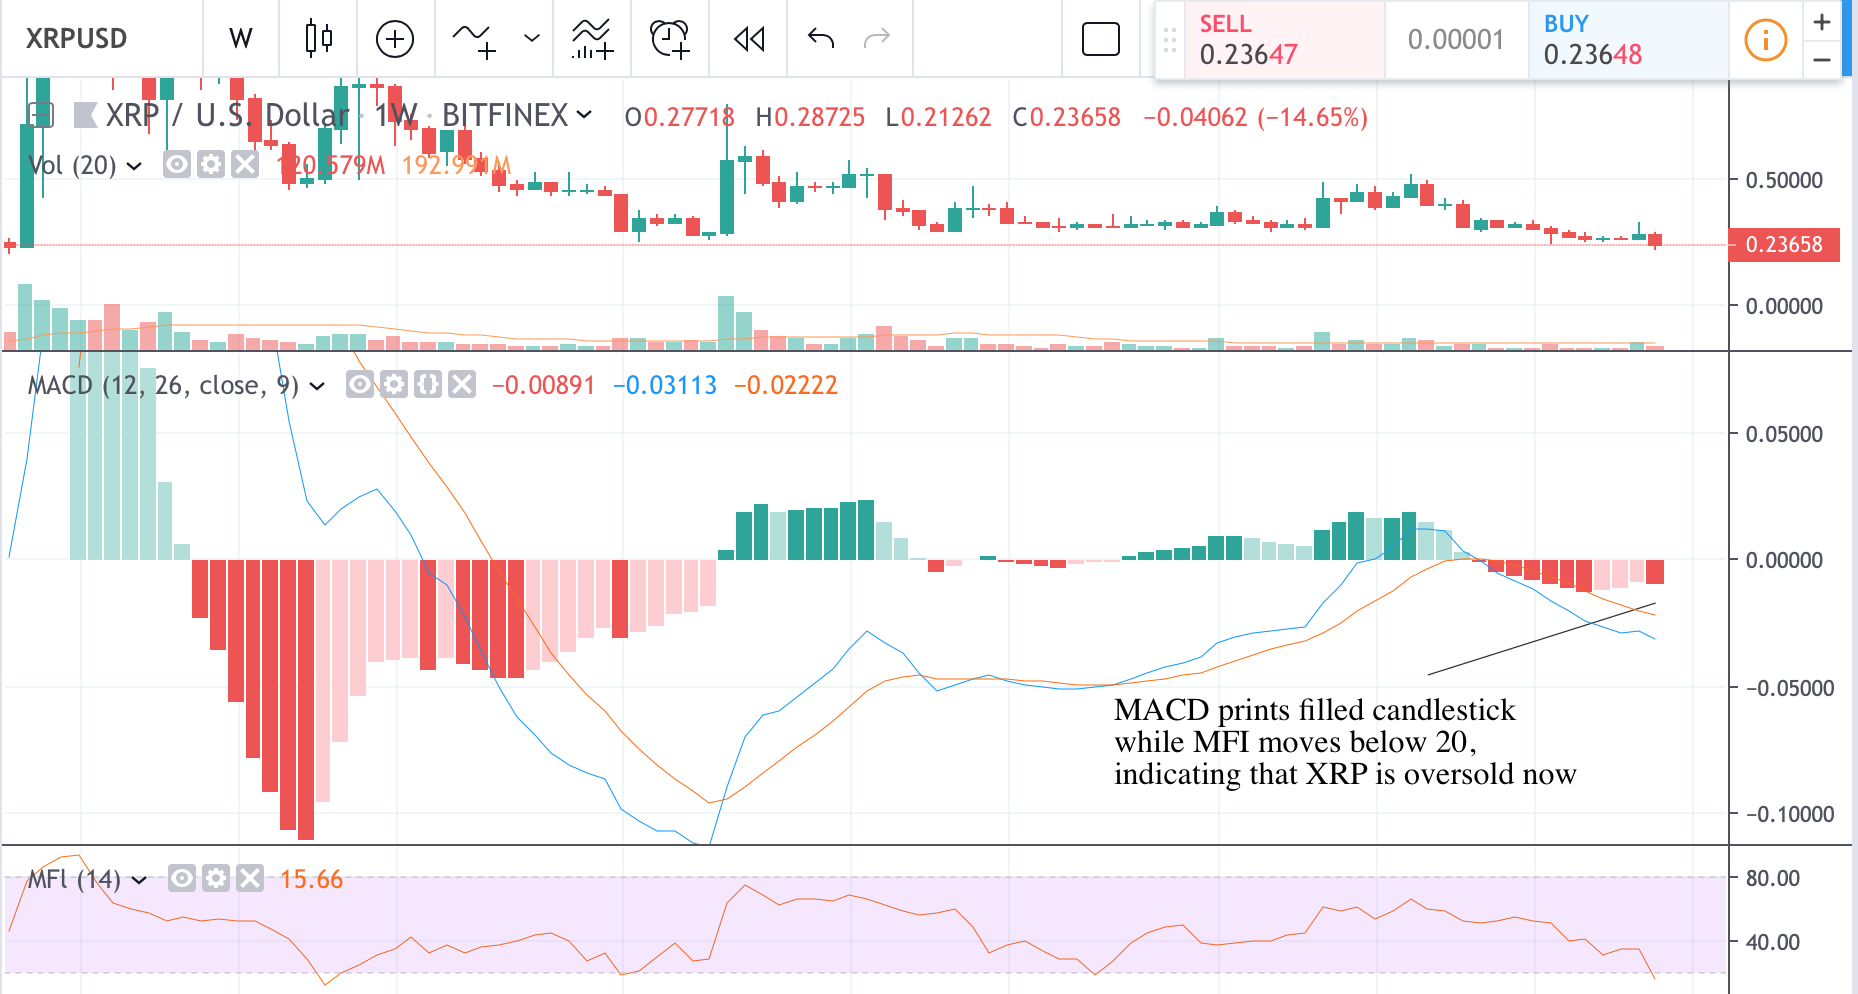
There seems to be a loss of bearish momentum as indicated by printed filled candle on MACD on the weekly trading chart. To confirm that it may not be the best of times to go short on XRP, one should also look at Money Flow Index indicator which is now below the value of 20, a clear indication that XRP is oversold at the moment.
Chart source: Tradingview
Disclaimer: Markets, instruments, and advice on this page are for informational purposes only and should not in any way come across as a recommendation to buy or sell in these assets. You should do your own thorough research before making any investment decisions. Ripplecoinnews does not in any way guarantee that this information is free from mistakes, errors, or material misstatements. Investing in Cryptocurrencies involves a great deal of risk, including the loss of all or a portion of your investment, as well as emotional distress. All risks, losses, and costs associated with investing, including total loss of principal, are your responsibility.


Flareonix Airdrop Is LIVE! Claim Your Share of 100M FXP Today!

Volatility Shares Launches First-Ever XRP Futures ETF On Nasdaq

XRP Has Officially Dethroned Tether Amid $1.2B Korean Volume

Ripple And XRP Receive Global Recognition As Mentioned In IIF’s BIS Response

Whale Alert: Bithumb Receives 20,000,000 XRP From An Unknown Wallet


Solana Blew Up—These 3 Underrated Altcoins Could Be Next in Line for 10,000% Gains!
After Solana’s incredible ascent, the spotlight is shifting to lesser-known cryptocurrencies that might be ready to soar. Three undervalued altcoins...

Under $1 and Primed to 1000x: The Altcoin Solana and Cardano Whales Are Quietly Buying Ahead of the Summer Surge!
Major investors are secretly acquiring a little-known cryptocurrency priced under a dollar, expecting a major surge this summer. Holders of...

Ethereum to $10K? XRP to $7? This New Altcoin Is Forecasted to Outperform Both!
Some analysts predict that major cryptocurrencies like Ethereum and XRP might soon hit impressive new price points. Yet, whispers in...


$TOKERO LevelUP Token is about to take over the crypto market mindshare!
TOKERO LevelUP Token Set to Transform Crypto Exchange Utility Through Innovative Multi-Ecosystem Integration The driving force behind TOKERO's revolutionary hybrid...

STG Energy Cloud Mining Platform: The Wealth Engine for Bitcoin and Solana Investments in 2025
In 2025, the cryptocurrency market is a whirlwind of volatility and opportunity. Bitcoin has dipped below $80,000 due to rumors...
