Technical Analysis
XRP price analysis. Long term outlook

- XRP/USD price remains at its low
- Narrowing horizontal channel
- Long term outlook is bullish
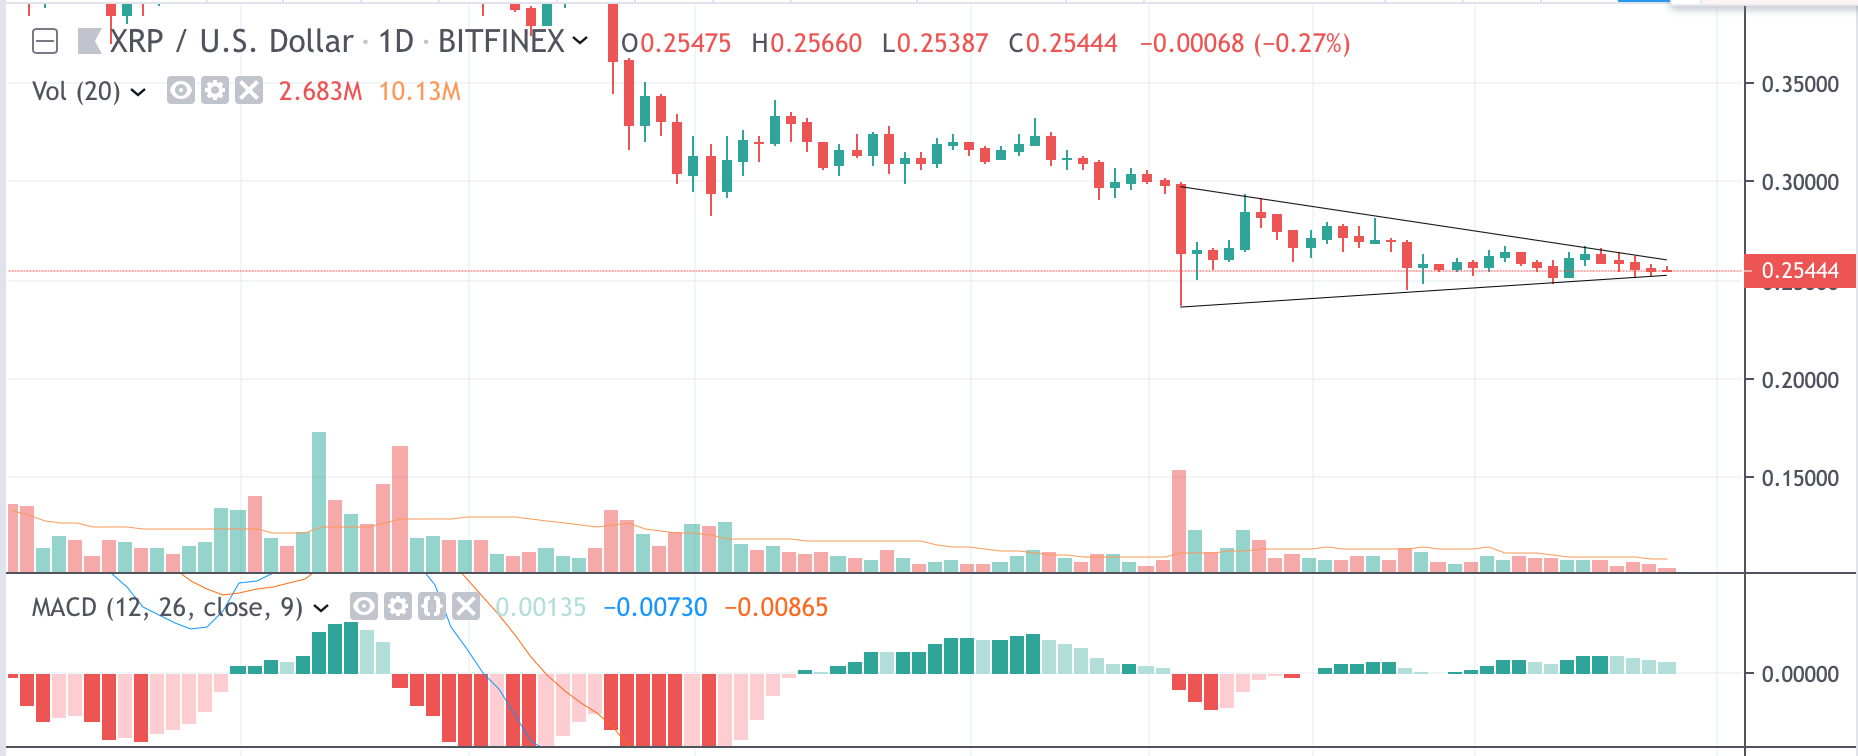
1 Day XRP/USD price chart

Ripple native coin XRP is currently trading at the levels of 2017 before its astonishing breakout. This historical support was also tested before in August/September of 2018. On August 14th, 2019 XRP set new low as price went down to $0.23630. The price then retraced to levels of $0.25 -$0.26. From that day on, XRP price is in the horizontal trading channel and we can see from the trend lines on 1 Day XRP/USD price chart that channel is narrowing, suggesting large momentum move in price.
Considering the fact that XRP price was trading mainly downwards since June 2019 and it is widely thought that bulls will soon take control of the market and uptrend will begin as a result. One of the most important oscillators, 1 Day MACD is suggesting that XRP is oversold now. The indicator has been in the green since the end of July.
Chart source: Tradingview
Disclaimer: Markets, instruments, and advice on this page are for informational purposes only and should not in any way come across as a recommendation to buy or sell in these assets. You should do your own thorough research before making any investment decisions. Ripplecoinnews does not in any way guarantee that this information is free from mistakes, errors, or material misstatements. Investing in Cryptocurrencies involves a great deal of risk, including the loss of all or a portion of your investment, as well as emotional distress. All risks, losses, and costs associated with investing, including total loss of principal, are your responsibility.


