Technical Analysis
XRP Price Analysis: Price is trying to find support near $0.3, where will it go next?
XRP has established a strong support at the $0.3 area. Price is currently trading at $0.33. Will it break support or is another rally in store? Read below to find out.
Long-Term Outlook
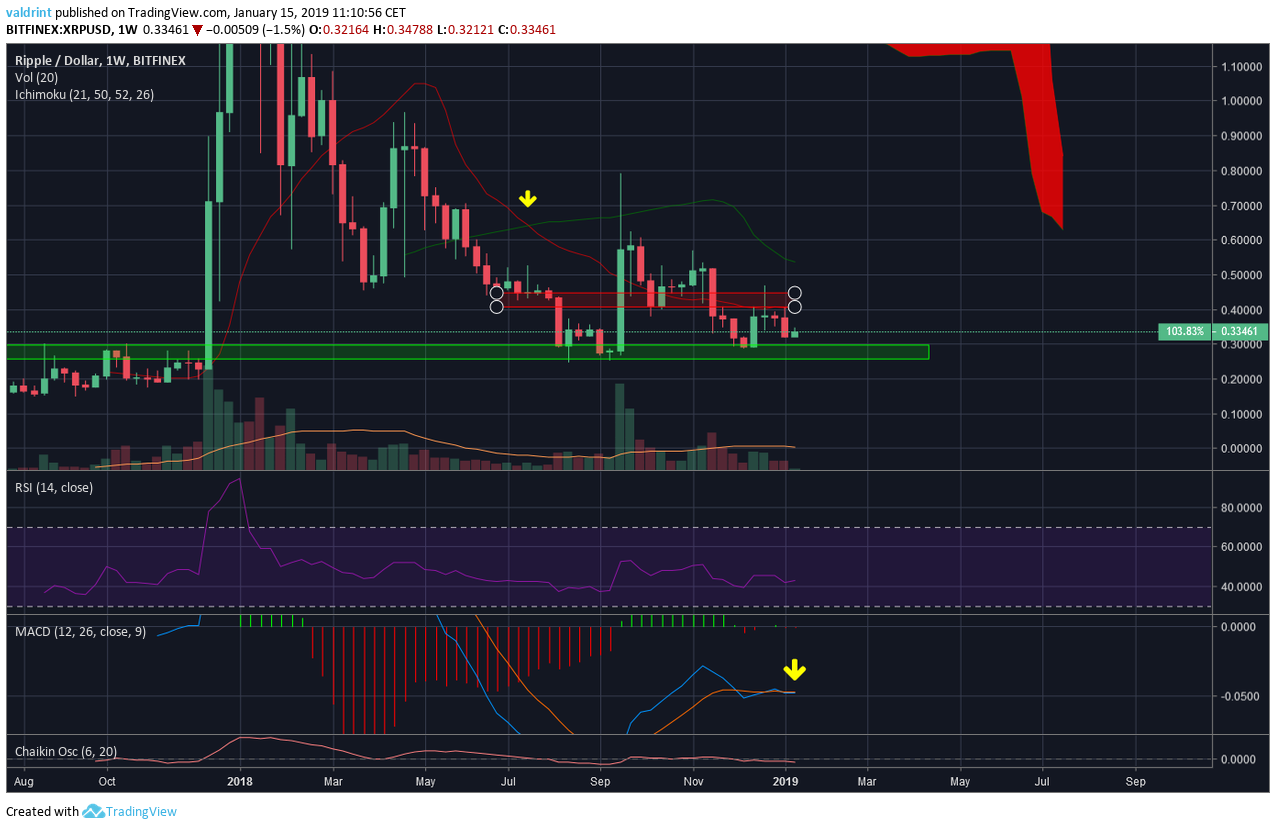
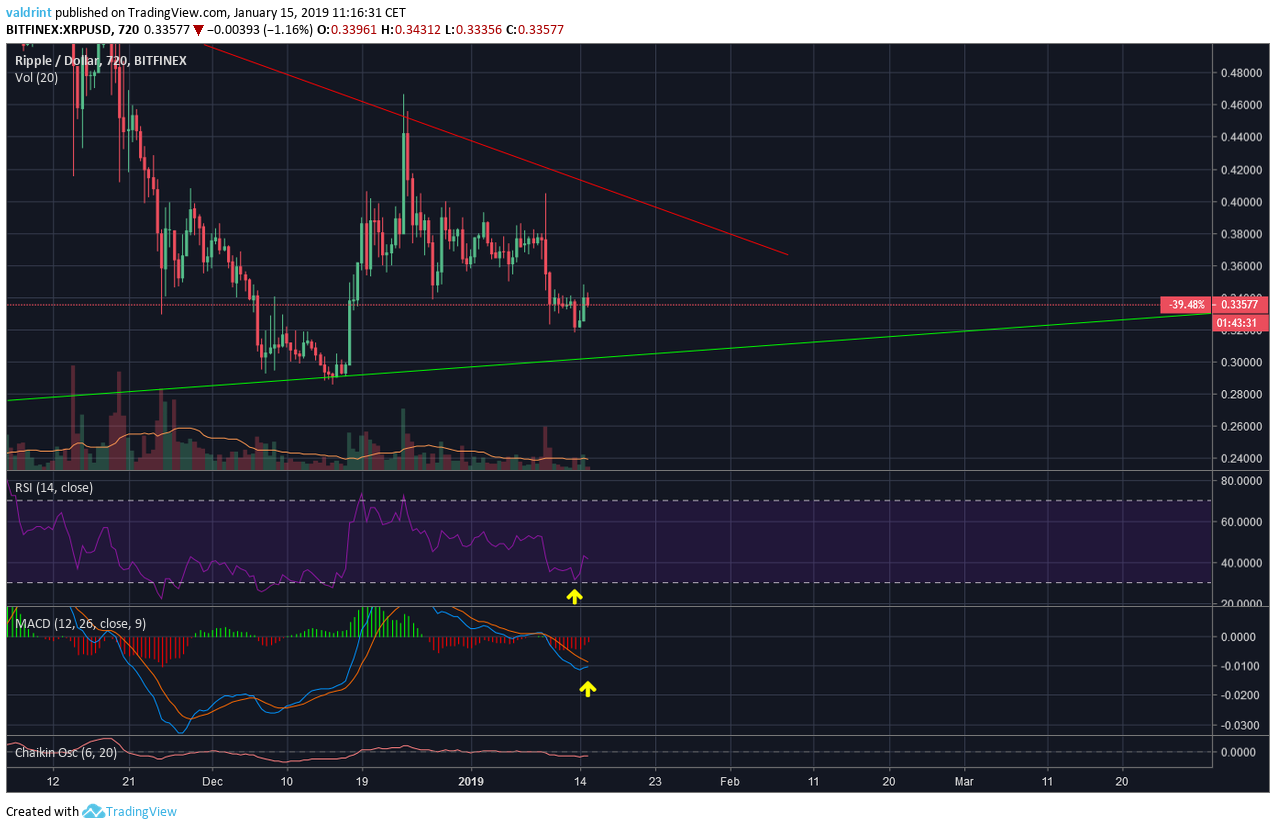
A glance at the Weekly chart for XRP displays that in the beginning of December price hit support at the $0.3 area (formed by the highs of August until October 2017 and subsequently lows of August until September 2018) and promptly reversed with a rally up to $0.4. Price made a spinning top candle which indicates indecision in the market and followed that with the formation of two bearish engulfing candles. Price is currently trading at $0.33. It is facing resistance from the 7-period moving average which coincides with the small resistance area and has previously made a bearish cross (yellow arrow). The RSI is at 40, indicating neither overbought nor oversold conditions. The MACD has lost all of its power, and its stuck between making a bearish and bullish cross.
Medium-Term Outlook
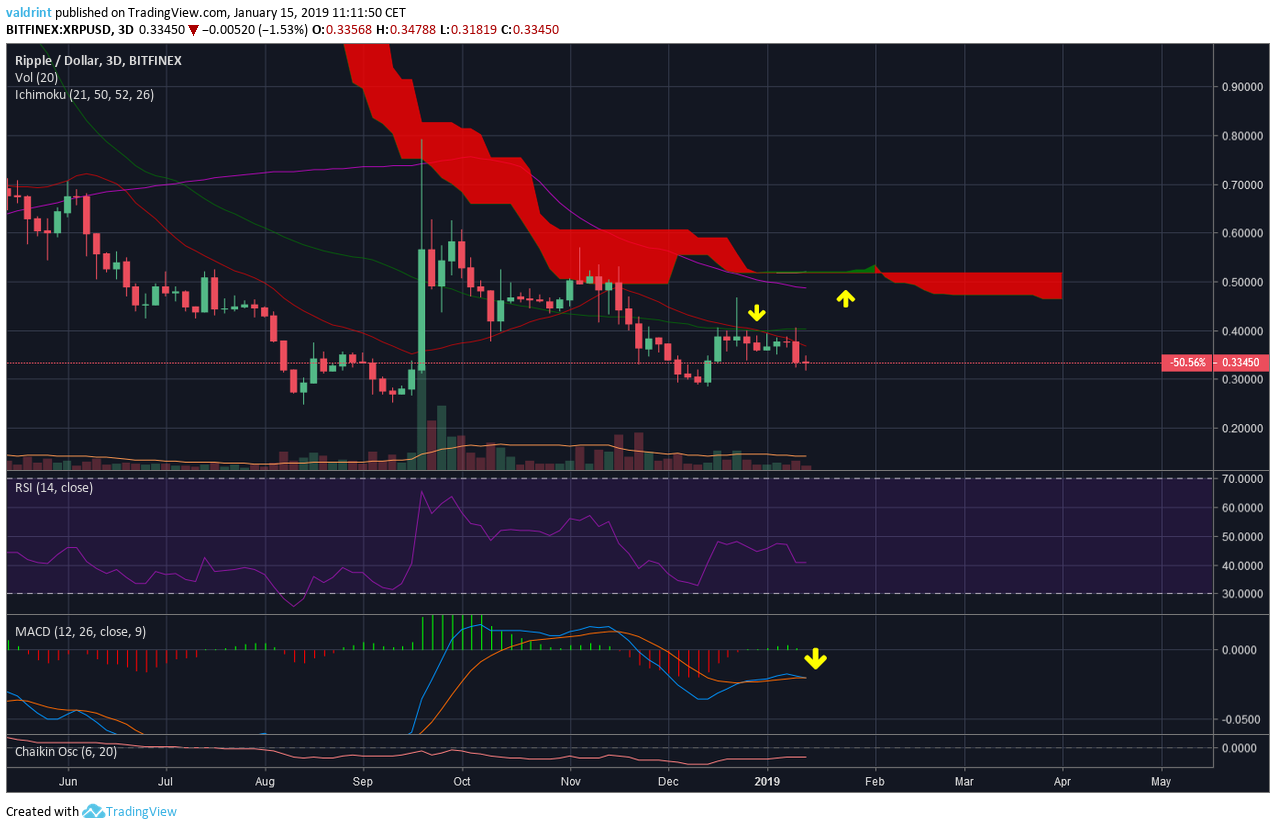
A look at the 3-day chart gives a similar picture. The RSI is at 40, indicating neither overbought nor oversold conditions, however it is close to being oversold. While the MACD previously made a bullish cross and was heading upward, it has promptly reversed and lost its power, now being close to making a bearish cross. Furthermore, the 7 and 21 period moving averages have made a bearish cross, both providing heavy resistance to price. Finally, price is facing resistance from the 50-period MA and the Ichimoku cloud. While there is a projected area within the cloud that is positive, given the current market conditions price seems unlikely to make a run for it.
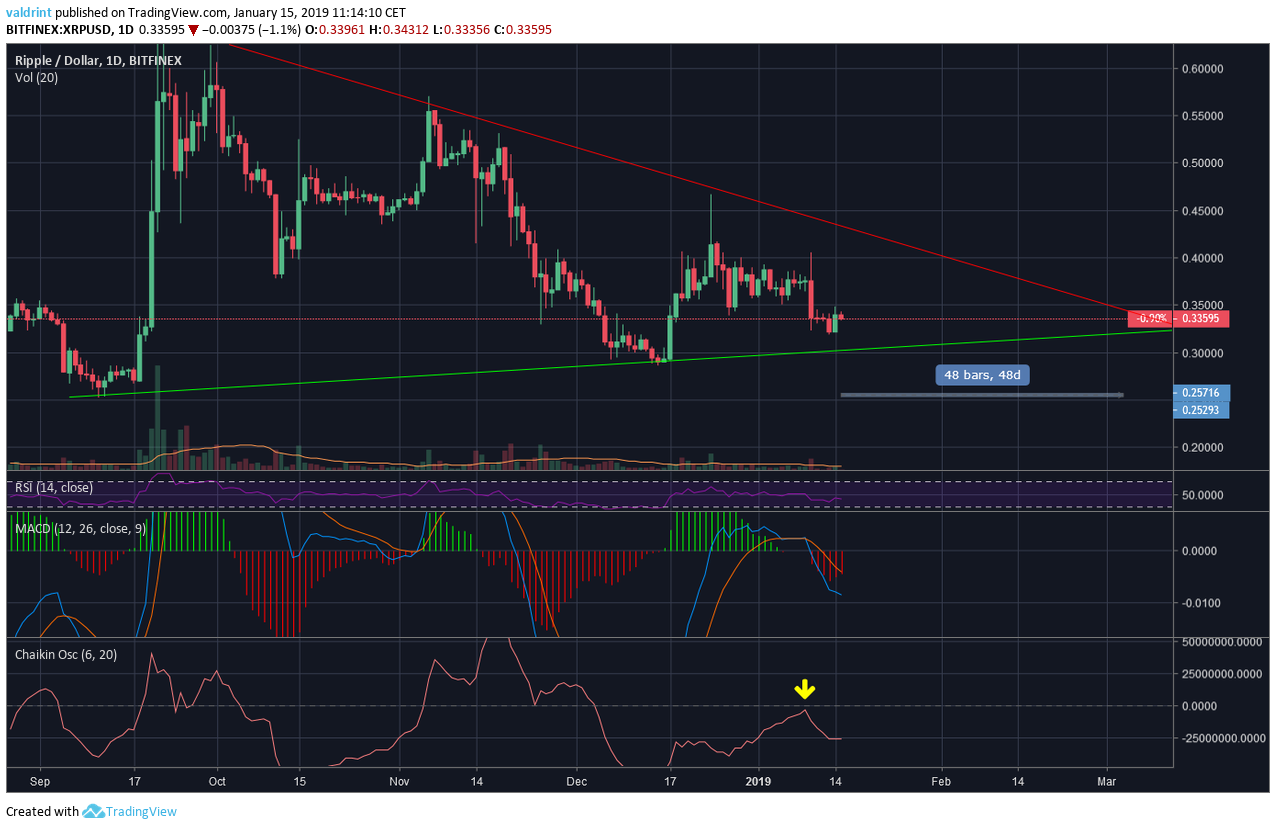
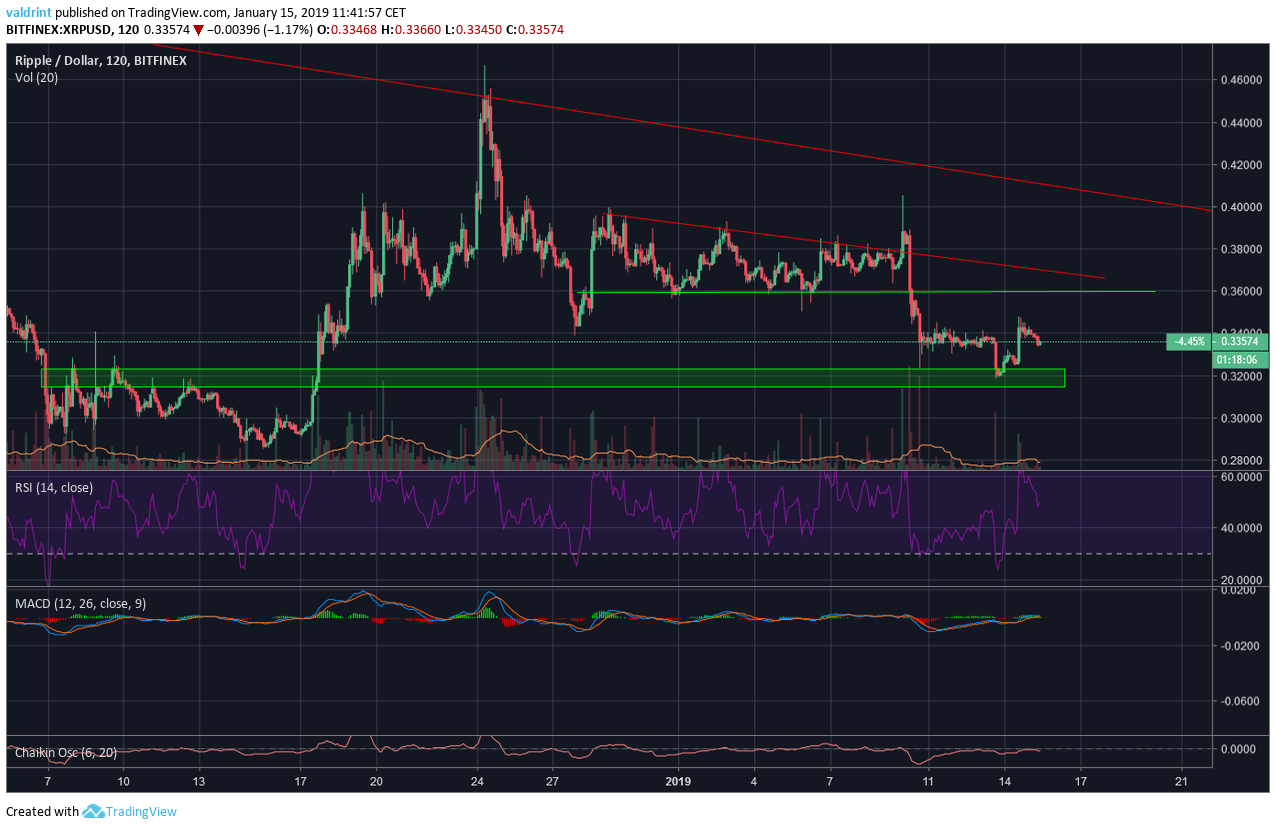
A look at the Daily chart for XRP shows that price is moving within a symmetrical triangle with resistance near $0.4 (red line) and support at $0.3 (green line). The MACD has made a bearish cross and is falling down, albeit with less power. Furthermore, the Chaikin oscillator got rejected at 0 without turning positive (A bearish sign). There is certainly a possibility that price only moves within the confines of the triangle for the next 50 days.
Short-Term Outlook
The 12-hour chart gives us more information about price movements. Price reversed after touching the resistance line at $0.44. The RSI is almost oversold, trading at 30. Furthermore, the MACD has been falling with less power, and seems to be close to making a bullish cross. There is no divergence of any kind yet.
Finally, a look at the 2-hour chart gives us another trading structure. Price broke down from the descending triangle it was trading in for the past two weeks, and fell to the mini-support area formed by the highs of December 7-17. This move is consistent with the analysis given in last weeks short-term outlook.
Conclusions
- The Daily timeframe shows that price is moving within a symmetrical triangle
- Indicators are slightly bearish
- In the short-term price broke down from a descending triangle.


Volatility Shares Launches First-Ever XRP Futures ETF On Nasdaq

XRP Has Officially Dethroned Tether Amid $1.2B Korean Volume

Ripple And XRP Receive Global Recognition As Mentioned In IIF’s BIS Response

Whale Alert: Bithumb Receives 20,000,000 XRP From An Unknown Wallet

XRP Futures Open Interest Registers $1B Rise In The Last Week


Solana Blew Up—These 3 Underrated Altcoins Could Be Next in Line for 10,000% Gains!
After Solana’s incredible ascent, the spotlight is shifting to lesser-known cryptocurrencies that might be ready to soar. Three undervalued altcoins...


Under $1 and Primed to 1000x: The Altcoin Solana and Cardano Whales Are Quietly Buying Ahead of the Summer Surge!
Major investors are secretly acquiring a little-known cryptocurrency priced under a dollar, expecting a major surge this summer. Holders of...


Ethereum to $10K? XRP to $7? This New Altcoin Is Forecasted to Outperform Both!
Some analysts predict that major cryptocurrencies like Ethereum and XRP might soon hit impressive new price points. Yet, whispers in...


$TOKERO LevelUP Token is about to take over the crypto market mindshare!
TOKERO LevelUP Token Set to Transform Crypto Exchange Utility Through Innovative Multi-Ecosystem Integration The driving force behind TOKERO's revolutionary hybrid...

STG Energy Cloud Mining Platform: The Wealth Engine for Bitcoin and Solana Investments in 2025
In 2025, the cryptocurrency market is a whirlwind of volatility and opportunity. Bitcoin has dipped below $80,000 due to rumors...
