Technical Analysis
XRP technical analysis. Price breakout is coming

- Ripple’s XRP price is in the consolidation zone on a one-day trading chart.
- 1 day MACD indicator is bullish and RSI indicator is 33.65 suggesting slight bullish pressure
- The current support is $0.25250, resistance is $0.25800
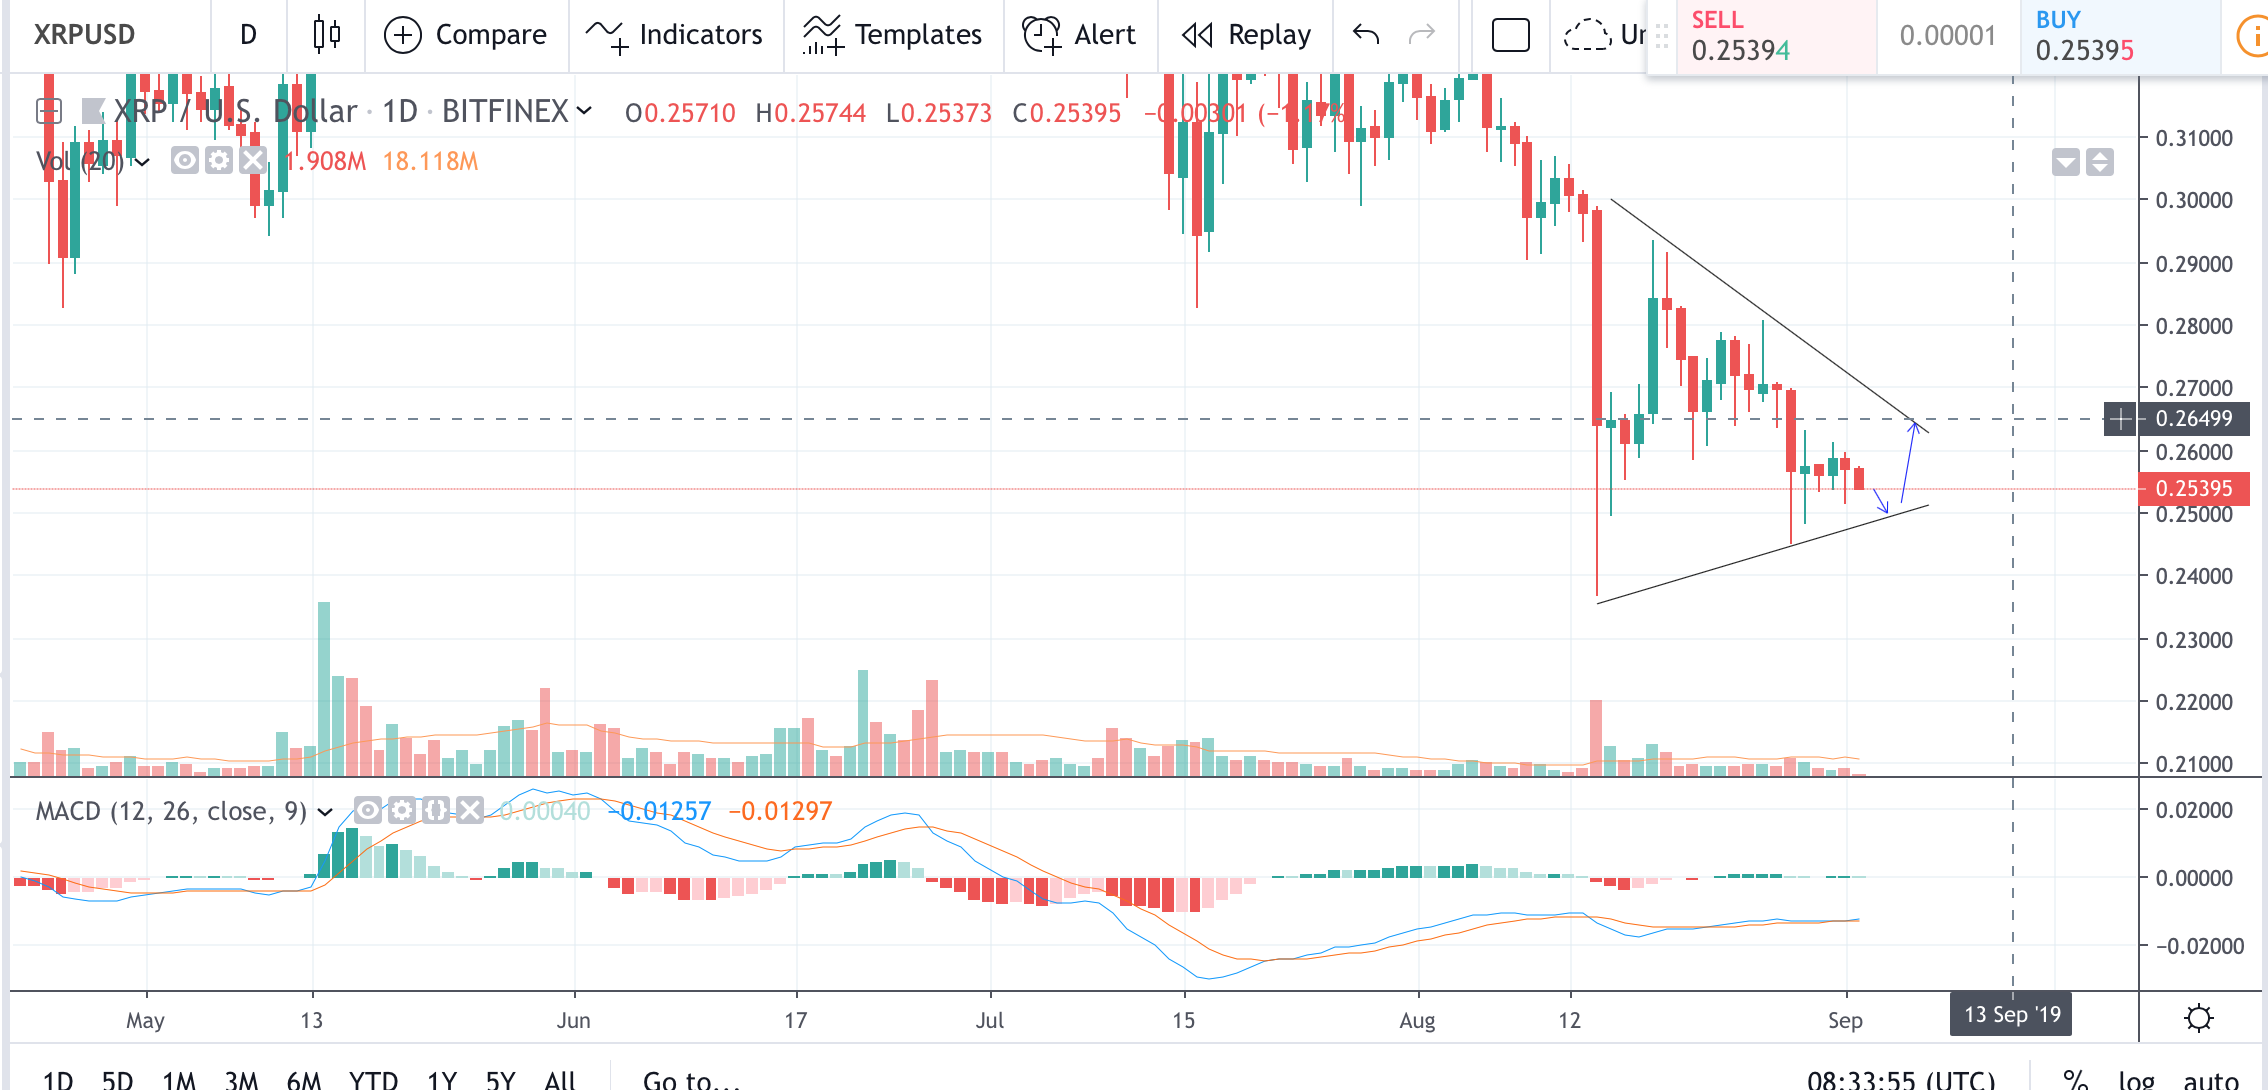
1 Day XRP/USD price chart

XRP/USD pair is still trading in the consolidation zone. The immediate is support is $0.25250. Future support levels are $0.25100 and $0.24750. Resistance levels are $0.25800, $0.2600, $0.26250 and $0.26500.
The current trend lines suggesting that price break out will follow in the near future. Price may still test support at $0.2500 and levels above, also test the resistance at $0.2600-$0.26500 before moving upward or downward on high momentum and establish new levels of support and resistance.
There are several low tail candlesticks formed on the 14th and 28th of August that may suggest decreasing bear interest. Coupled with slightly bullish MACD and RSI indicators on the one-day price chart may reinforce the belief of upcoming uptrend.
However, traders need to be cautious as long term outlook demonstrated by the same indicators on one week chart is currently bearish.
Chart source: Tradingview
Disclaimer: Markets, instruments and advices on this page are for informational purposes only and should not in any way come across as a recommendation to buy or sell in these assets. You should do your own thorough research before making any investment decisions. Ripplecoinnews does not in any way guarantee that this information is free from mistakes, errors, or material misstatements. Investing in Cryptocurrencies involves a great deal of risk, including the loss of all or a portion of your investment, as well as emotional distress. All risks, losses and costs associated with investing, including total loss of principal, are your responsibility.


