Technical Analysis
XRP/USD price is showing signs of mounting buying pressure
- Ripple’s XRP/USD price is trading sideways after a major downtrend.
- 1 Hour MACD indicator is bullish.
- The current support is at $0.247. Immediate resistance is $0.258
1-Hour XRP/USD Price chart
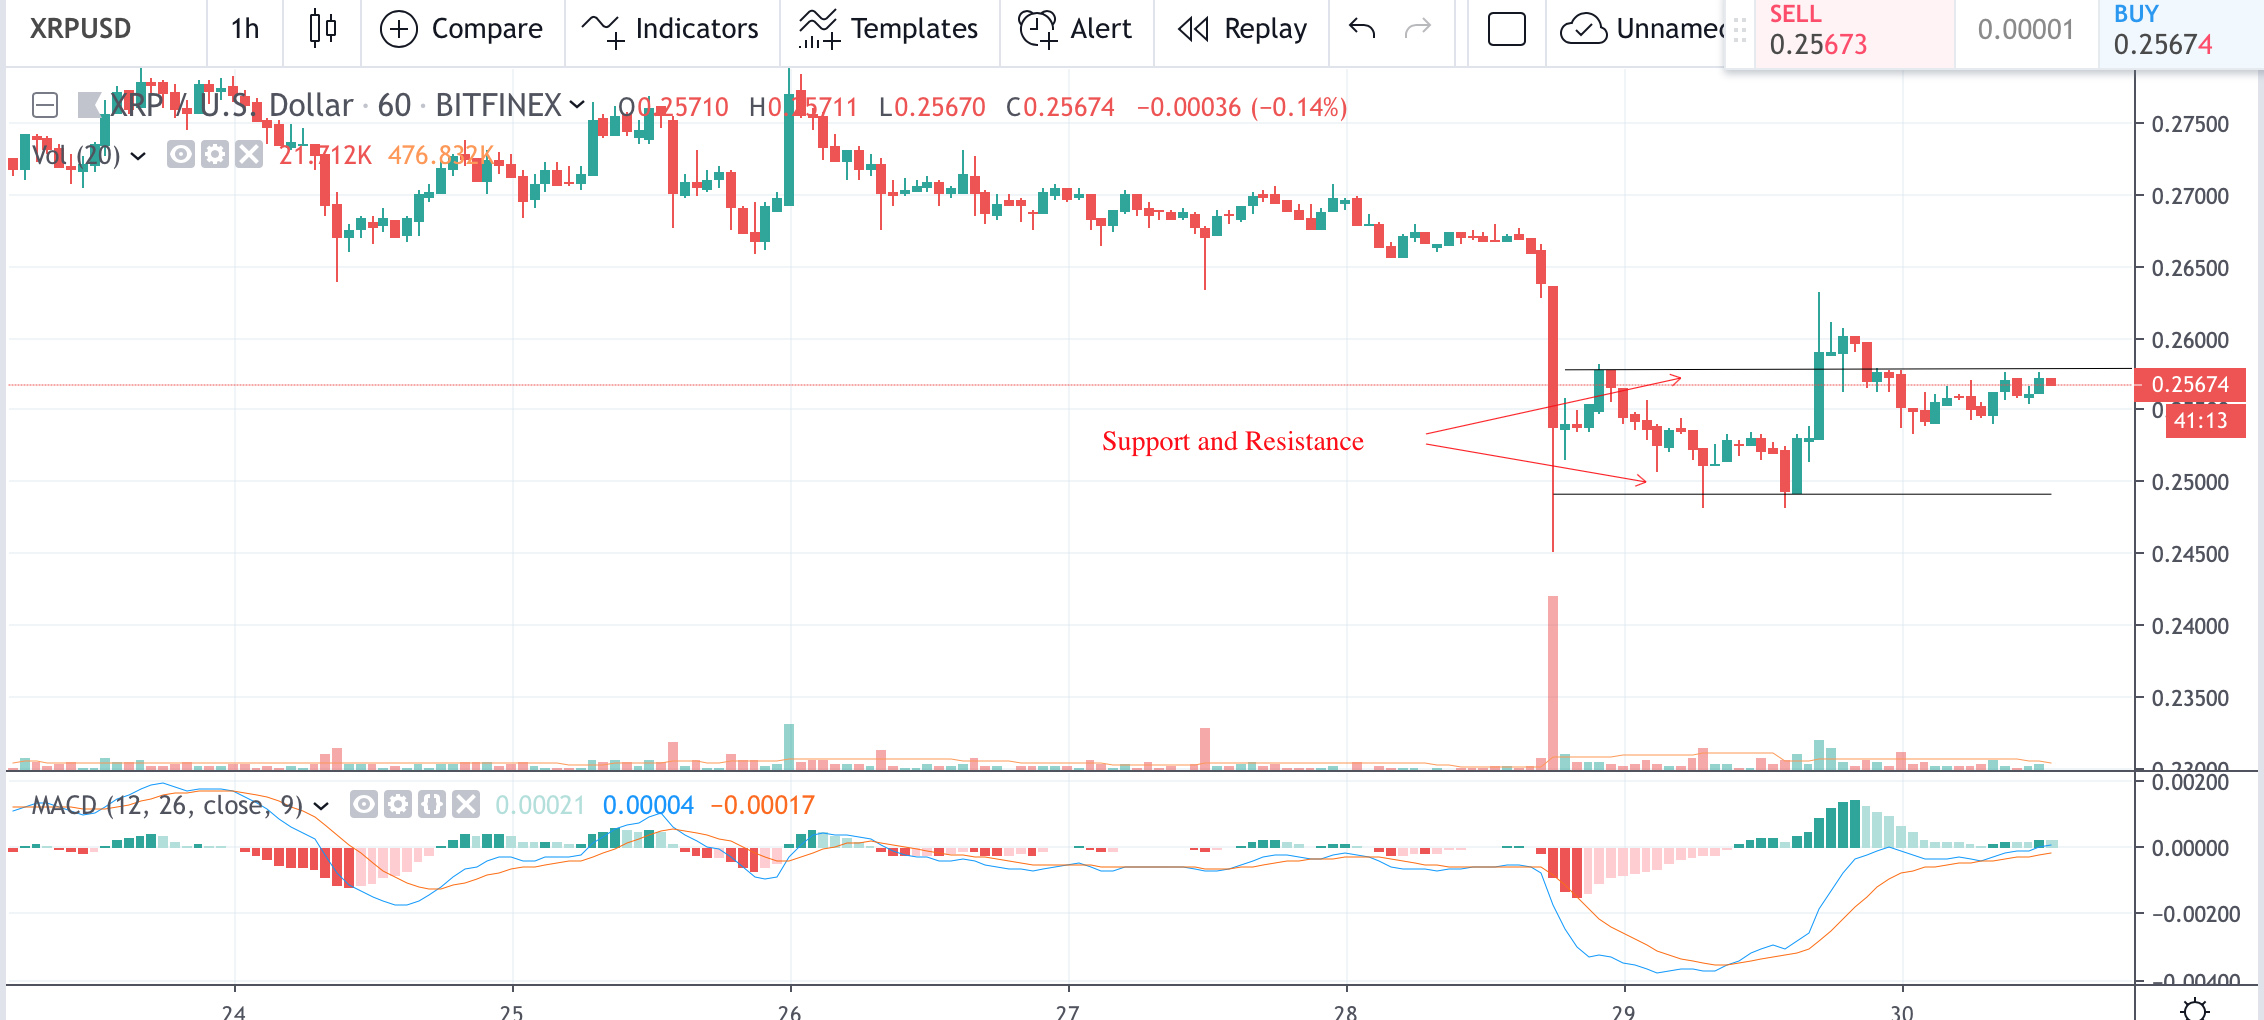
Recent downtrend which saw XRP/USD price decreased by around 5%. Ripple native currency has consolidated and is trading sideways. XRP managed to move away from the support line of $0.247 and even tried to establish an uptrend hitting $0.263 in the process. However, immediate retracement followed and the price has now consolidated just below current resistance of $0.258.
Bullish pressure is clearly visible on one and one-day hour charts with resistance being tested several times already. If it is broken XRP will face new resistance levels at $0.260 and $0.265. In the case of the price decrease, XRP may go down to $0.245 or lower. However, this scenario is less likely in the short term as technical indicators (1hour and 1-day MACD and RSI indexes) are suggesting XRP is oversold at the moment.
Chart source: Tradingview
Disclaimer: Markets, instruments and advices on this page are for informational purposes only and should not in any way come across as a recommendation to buy or sell in these assets. You should do your own thorough research before making any investment decisions. Ripplecoinnews does not in any way guarantee that this information is free from mistakes, errors, or material misstatements. Investing in Cryptocurrencies involves a great deal of risk, including the loss of all or a portion of your investment, as well as emotional distress. All risks, losses and costs associated with investing, including total loss of principal, are your responsibility.


Ripple (XRP), ETFSwap (ETFS), And Ondo Finance (ONDO) Are Leading The Crypto ETF Economy

Ripple CEO Says XRP ETF Is Coming – Here’s How To Position For This Bullish Event

Bitcoin’s Value Climbs Above $71,000 Ahead of Impending Halving Event

Best Bitcoin Miners in 2024

BlockDAG’s Visionary Leap: Sparking a Crypto Revolution with 5000% ROI Potential
Ripple (XRP), ETFSwap (ETFS), And Ondo Finance (ONDO) Are Leading The Crypto ETF Economy
ETFSwap (ETFS), along with Ripple (XRP) and Ondo Finance (ONDO), is spearheading the dynamic crypto ETF economy, paving the way...
Ripple CEO Says XRP ETF Is Coming – Here’s How To Position For This Bullish Event
Ripple CEO, Brad Garlinghouse, has suggested the possibility of an XRP ETF being approved by governmental authorities soon. He made...

BlockDAG’s Visionary Leap: Sparking a Crypto Revolution with 5000% ROI Potential
BlockDAG’s groundbreaking announcement has stirred a wave of excitement in the cryptocurrency community, following its keynote presentation broadcasted across the...


Earn Passive Income Quickly with ARKMining Cloud Mining – Daily Profits
ARKMining, a leading cloud mining platform, recently released a complete analysis report demonstrating its potential to help individuals easily earn...


Top Crypto Altcoins of 2024: SHIB, MK, and BDAG – Unlock Your Path to Growth and Profit
The best crypto altcoins of 2024, according to top crypto analysts are Shiba Inu (SHIB), Meme Kombat (MK), and BlockDAG...
