Technical Analysis
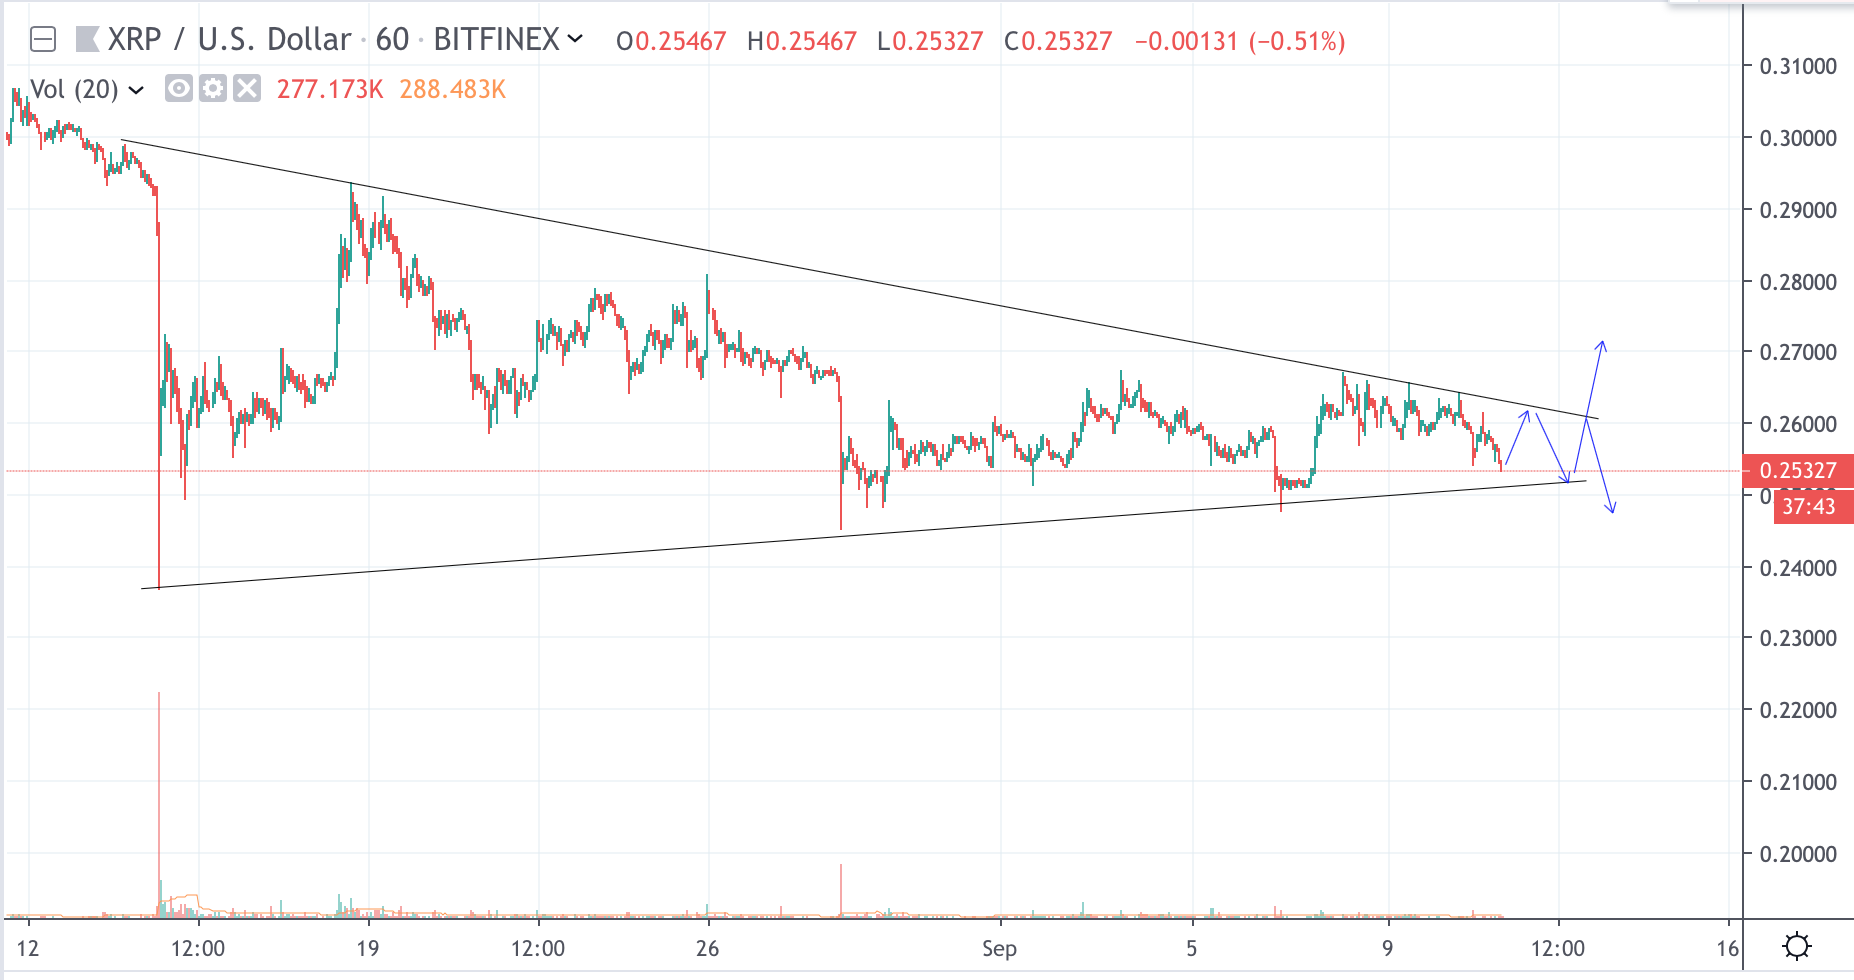
XRP/USD price pattern is narrowing further

- XRP is down by 2.30% against US dollar
- Oscillators are neutral/bullish
- New support at $0.25300. Previous support at $0.2600 is new resistance
1 Hour XRP/USD price chart

XRP failed to move up on bullish pressure and as a result, bears managed to get the price down by another 2.3% against the US dollar. The support level at $0.2600 was broken and the price is now down to $0.25300, which can be considered new support. Resistance is now at $0.2600.
The pattern on the chart clearly demonstrates that XRP price is now in the narrowing trading channel, so we can expect a breakout soon. The question remains will it an uptrend or further downfall? Long term technical indicators, such as MACD and RSI are suggesting slight bullish momentum, meaning that XRP can be considered oversold at the moment. However, growing frustration amongst XRP community with Ripple company dumping XRP may potentially trigger higher volumes of the cryptocurrency to be offloaded, thus encouraging further downtrend.
Chart source: Tradingview
Disclaimer: Markets, instruments and advices on this page are for informational purposes only and should not in any way come across as a recommendation to buy or sell in these assets. You should do your own thorough research before making any investment decisions. Ripplecoinnews does not in any way guarantee that this information is free from mistakes, errors, or material misstatements. Investing in Cryptocurrencies involves a great deal of risk, including the loss of all or a portion of your investment, as well as emotional distress. All risks, losses and costs associated with investing, including total loss of principal, are your responsibility.


