Technical Analysis
XRP/USD Technical Analysis 01/09/2018
In the technical analysis last week I was saying that XRP / USD will move up to the first line of resistance R1- 0.42 usd. Once it reaches that area, the price will be rejected and a corrective wave will begin. Indeed, XRP/USD moved up, but it did not reach 0.42 usd. The bulls were not strong enough, and the price reached a maximum of only 0.36 usd. Later I had a slight correction after which the price had a lateral movement.
The evolution of the last two weeks of the XRP / USD price suggests that we are in a consolidation period. The technical analysis of today will be a combined one. We will have a long term TA and a TA for the next week. We’ll take a brief look at the Bitcoin chart, and then we’ll look at the XRP / USD chart.
What can we say about the Bitcoin chart below?
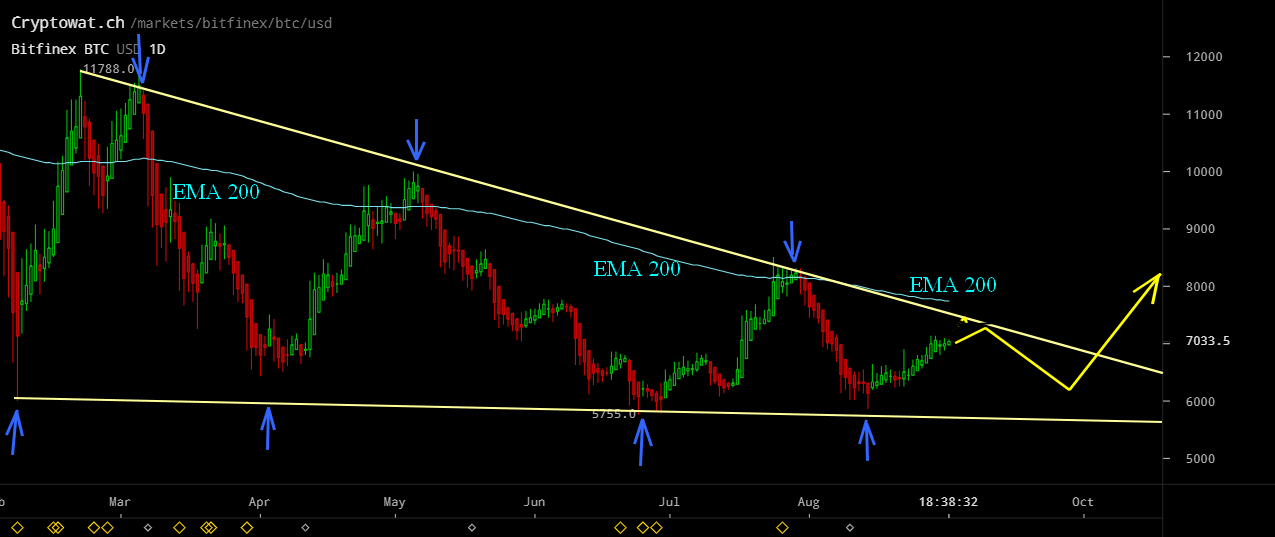
First of all, the Bitcoin price continues to evolve within the Falling Wadge pattern. Bitcoin has not managed to make a break up and keep above the top line of this pattern. To be able to talk about the beginning of a bull market, we need two conditions:
1. Break up and keep above the Falling Wadge pattern.
2. Break up and keep above the EMA 200 (blue line).
I’ve also said another time that Falling Wadge is a pattern that predicts a bull market. We notice that the Falling Wadge pattern is actually a triangle. We are approaching the point of this triangle. Sometime in the coming months, this pattern will be broken up.
EMA 200 is an important indicator of the long-term trend of capital markets. For many buy and hold traders, breaking up the EMA 200 line will be an important buy signal. Breaking up and maintaining over EMA 200 signifies the emergence of the bull market.
However, I estimate that the fulfillment of the two above conditions will not happen in the next period. The first condition is likely to occur in the next 2-4 months, with the second condition being met in the first months of 2019. This shows the evolution of the Bitcoin chart at this time.
What can we say about the XRP / USD chart below?
First of all we have the same Falling Wadge pattern as on the Bitcoin chart. In order to be able to talk about a bull market and here on XRP / USD, the two conditions described in the Bitcoin analysis must be met.
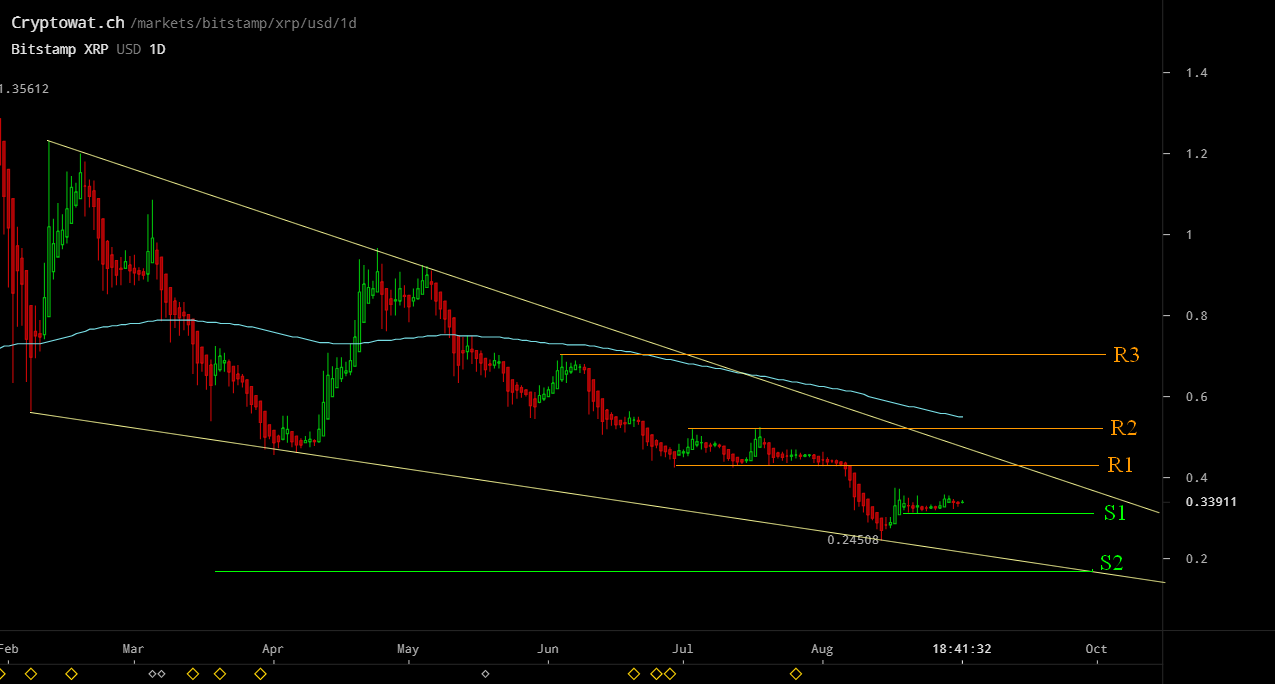
The resistance lines: The support lines:
R1 – 0,42 USD S1 – 0,31 USD
R2 – 0,50 USD (psychological) S2 – 0,15 USD
R3 – 0,75 USD
What’s happening on XRP / USD next week?
XRP / USD will follow the Bitcoin trend. In the last two weeks the Bitcoin price has been quite stable. It seems that at this moment we are witnessing a move like: up > consolidation > up. I maintain my estimate that XRP / USD will have a lateral consolidation move, after which it will climb to R1- 0.42 usd.
Do not forget that any capital market, including the Crypto Market, has cycles. This bearish trend can not last forever. In fact, the cheap prices at the moment represent an extraordinary investment opportunity for anyone.


Ripple (XRP), ETFSwap (ETFS), And Ondo Finance (ONDO) Are Leading The Crypto ETF Economy

Ripple CEO Says XRP ETF Is Coming – Here’s How To Position For This Bullish Event

Bitcoin’s Value Climbs Above $71,000 Ahead of Impending Halving Event

Best Bitcoin Miners in 2024

BlockDAG’s Visionary Leap: Sparking a Crypto Revolution with 5000% ROI Potential
Ripple (XRP), ETFSwap (ETFS), And Ondo Finance (ONDO) Are Leading The Crypto ETF Economy
ETFSwap (ETFS), along with Ripple (XRP) and Ondo Finance (ONDO), is spearheading the dynamic crypto ETF economy, paving the way...
Ripple CEO Says XRP ETF Is Coming – Here’s How To Position For This Bullish Event
Ripple CEO, Brad Garlinghouse, has suggested the possibility of an XRP ETF being approved by governmental authorities soon. He made...

BlockDAG’s Visionary Leap: Sparking a Crypto Revolution with 5000% ROI Potential
BlockDAG’s groundbreaking announcement has stirred a wave of excitement in the cryptocurrency community, following its keynote presentation broadcasted across the...


Earn Passive Income Quickly with ARKMining Cloud Mining – Daily Profits
ARKMining, a leading cloud mining platform, recently released a complete analysis report demonstrating its potential to help individuals easily earn...


Top Crypto Altcoins of 2024: SHIB, MK, and BDAG – Unlock Your Path to Growth and Profit
The best crypto altcoins of 2024, according to top crypto analysts are Shiba Inu (SHIB), Meme Kombat (MK), and BlockDAG...
